Causal Analysis in Theory and Practice

December 22, 2014

Flowers of the First Law of Causal Inference

Filed under: Counterfactual,Definition,General,structural equations — judea @ 5:22 am

Flower 1 — Seeing counterfactuals in graphs

Some critics of structural equations models and their associated graphs have complained that those graphs depict only observable variables but: “You can’t see the counterfactuals in the graph.” I will soon show that this is not the case; counterfactuals can in fact be seen in the graph, and I regard it as one of many flowers blooming out of the First Law of Causal Inference (see here). But, first, let us ask why anyone would be interested in locating counterfactuals in the graph.

This is not a rhetorical question. Those who deny the usefulness of graphs will surely not yearn to find counterfactuals there. For example, researchers in the Imbens-Rubin camp who, ostensibly, encode all scientific knowledge in the “Science” = Pr(W,X,Y(0),Y(1)), can, theoretically, answer all questions about counterfactuals straight from the “science”; they do not need graphs.

On the other extreme we have students of SEM, for whom counterfactuals are but byproducts of the structural model (as the First Law dictates); so, they too do not need to see counterfactuals explicitly in their graphs. For these researchers, policy intervention questions do not require counterfactuals, because those can be answered directly from the SEM-graph, in which the nodes are observed variables. The same applies to most counterfactual questions, for example, the effect of treatment on the treated (ETT) and mediation problems; graphical criteria have been developed to determine their identification conditions, as well as their resulting estimands (see here and here).

So, who needs to see counterfactual variables explicitly in the graph?

There are two camps of researchers who may benefit from such representation. First, researchers in the Morgan-Winship camp (link here) who are using, interchangeably, both graphs and potential outcomes. These researchers prefer to do the analysis using probability calculus, treating counterfactuals as ordinary random variables, and use graphs only when the algebra becomes helpless. Helplessness arises, for example, when one needs to verify whether causal assumptions that are required in the algebraic derivations (e.g., ignorability conditions) hold true in one’s model of reality. These researchers understand that “one’s model of reality” means one’s graph, not the “Science” = Pr(W,X,Y(0),Y(1)), which is cognitively inaccessible. So, although most of the needed assumptions can be verified without counterfactuals from the SEM-graphs itself (e.g., through the back door condition), the fact that their algebraic expressions already carry counterfactual variables makes it more convenient to see those variables represented explicitly in the graph.

The second camp of researchers are those who do not believe that scientific knowledge is necessarily encoded in an SEM-graph. For them, the “Science” = Pr(W,X,Y(0),Y(1)), is the source of all knowledge and assumptions, and a graph may be constructed, if needed, as an auxiliary tool to represent sets of conditional independencies that hold in Pr(*). [I was surprised to discover sizable camps of such researchers in political science and biostatistics; possibly because they were exposed to potential outcomes prior to studying structural equation models.] These researchers may resort to other graphical representations of independencies, not necessarily SEM-graphs, but occasionally seek the comfort of the meaningful SEM-graph to facilitate counterfactual manipulations. Naturally, they would prefer to see counterfactual variables represented as nodes on the SEM-graph, and use d-separation to verify conditional independencies, when needed.

After this long introduction, let us see where the counterfactuals are in an SEM-graph. They can be located in two ways, first, augmenting the graph with new nodes that represent the counterfactuals and, second, mutilate the graph slightly and use existing nodes to represent the counterfactuals.

The first method is illustrated in chapter 11 of Causality (2nd Ed.) and can be accessed directly here. The idea is simple: According to the structural definition of counterfactuals, Y(0) (similarly Y(1)) represents the value of Y under a condition where X is held constant at X=0. Statistical variations of Y(0) would therefore be governed by all exogenous variables capable of influencing Y when X is held constant, i.e. when the arrows entering X are removed. We are done, because connecting these variables to a new node labeled Y(0), Y(1) creates the desired representation of the counterfactual. The book-section linked above illustrates this construction in visual details.

The second method mutilates the graph and uses the outcome node, Y, as a temporary surrogate for Y(x), with the understanding that the substitution is valid only under the mutilation. The mutilation required for this substitution is dictated by the First Law, and calls for removing all arrows entering the treatment variable X, as illustrated in the following graph (taken from here).
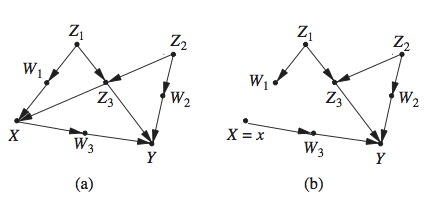
This method has some disadvantages compared with the first; the removal of X’s parents prevents us from seeing connections that might exist between Y_x and the pre-intervention treatment node X (as well as its descendants). To remedy this weakness, Shpitser and Pearl (2009) (link here) retained a copy of the pre-intervention X node, and kept it distinct from the manipulated X node.

Equivalently, Richardson and Robins (2013) spliced the X node into two parts, one to represent the pre-intervention variable X and the other to represent the constant X=x.

All in all, regardless of which variant you choose, the counterfactuals of interest can be represented as nodes in the structural graph, and inter-connections among these nodes can be used either to verify identification conditions or to facilitate algebraic operations in counterfactual logic.

Note, however, that all these variants stem from the First Law, Y(x) = Y[M_x], which DEFINES counterfactuals in terms of an operation on a structural equation model M.

Finally, to celebrate this “Flower of the First Law” and, thereby, the unification of the structural and potential outcome frameworks, I am posting a flowery photo of Don Rubin and myself, taken during Don’s recent visit to UCLA.

December 7, 2012

On Structural Equations versus Causal Bayes Networks

Filed under: Counterfactual,structural equations — eb @ 6:00 pm

We received the following query from Jim Grace, (USGS – National Wetlands Research Center) :
Hi Judea,

In your 2009 edition of Causality on pages 26-27 you explain your reasoning for now preferring to express causal rules from a Laplacian quasi-deterministic perspective rather than stay with the stochastic conceptualization associated with Bayesian Networks. It seems to me that a practical matter here is the reliance of traditional graph theory on discrete mathematics and the constraints that places on functional forms and, therefore, counterfactual arguments. Despite that clear logic, one sees the occasional discussion of “causal Bayes nets” and I wondered if you would dissuade people (if people can be dissuaded) from trying to evolve a causal modeling methodology with discrete Bayes nets as their starting point?

Judea Pearl answers:
Dear Jim,

I would not dissuade people from using either causal Bayesian causal networks or structural equation models, because the difference between the two is so minute that it is not worth the dissuasion. The question is only what question you ask yourself when you construct the diagram. If you feel more comfortable asking: What factors determine the value of this variable” then you construct a structural equation model. If on the other hand you prefer to ask: “If I intervene and wiggle this variable, would the probability of the other variable change?” then the outcome would be a causal Bayes network. Rarely do they differ (but see example on page 35 of Causality).

December 4, 2012

Neyman-Rubin’s model and ASA Causality Prize

We received the following query from Megan Murphy (ASA):
Dr. Pearl,
I received the following question regarding the Causality in Statistics Education prize on twitter. I’m not sure how to answer this, perhaps you can help?

Would entries using Neyman-Rubin model even be considered? RT @AmstatNews: Causality in Statistics Education #prize magazine.amstat.org/blog/2012/11/0…

Judea Answers:
“Of course! The criteria for evaluation specifically state: ‘in some mathematical language (e.g., counterfactuals, equations, or graphs)’ giving no preference to any of the three notational systems. The criteria stress capabilities to perform specific inference tasks, regardless of the tools used in performing the tasks.

For completeness, I re-list below the evaluation criteria:

• The extent to which the material submitted equips students with skills needed for effective causal reasoning. These include:

—1a. Ability to correctly classify problems, assumptions, and claims into two distinct categories: causal vs. associational

—1b. Ability to take a given causal problem and articulate in some mathematical language (e.g., counterfactuals, equations, or graphs) both the target quantity to be estimated and the assumptions one is prepared to make (and defend) to facilitate a solution

—1c. Ability to determine, in simple cases, whether control for covariates is needed for estimating the target quantity, what covariates need be controlled, what the resulting estimand is, and how it can be estimated using the observed data

—1d. Ability to take a simple scenario (or model), determine whether it has statistically testable implications, and apply data to test the assumed scenario

• The extent to which the submitted material assists statistics instructors in gaining an understanding of the basics of causal inference (as outlined in 1a-d) and prepares them to teach these basics in undergraduate and lower-division graduate classes in statistics.

Those versed in the Neyman-Rubin model are most welcome to submit nominations.

Note, however, that nominations will be evaluated on ALL four skills, 1a – 1d.
Judea

November 25, 2012

Conrad (Ontario/Canada) on SEM in Epidemiology

Filed under: Counterfactual,Epidemiology,structural equations — moderator @ 4:00 am

Conrad writes:

In the recent issue of IJE (http://aje.oxfordjournals.org/content/176/7/608), Tyler VanderWeele argues that SEM should be used in Epidemiology only when 1) the interest is on a wide range of effects 2) the purpose of the analysis is to generate hypothesis. However if the interest is on a single fixed exposure, he thinks traditional regression methods are more superior.

According to him, the latter relies on fewer assumptions e.g. we don’t need to know the functional form of the association between a confounder and exposure (or outcome) during estimation, and hence are less prone to bias. How valid is this argument given that some of (if not all) the causal modeling methods are simply a special case of SEM (e.g. the Robin’s G methods and even the regression methods he’s talking about).

Judea replies:

Dear Conrad,

Thank you for raising these questions about Tyler’s article. I believe several of Tyler’s statements stand the risk of being misinterpreted by epidemiologists, for they may create the impression that the use of SEM, including its nonparametric variety, is somehow riskier than the use of other techniques. This is not the case. I believe Tyler’s critics were aimed specifically at parametric SEM, such as those used in Arlinghaus etal (2012), but not at nonparametric SEMs which he favors and names “causal diagrams”. Indeed, nonparametric SEM’s are blessed with unequal transparency to assure that each and every assumption is visible and passes the scrutiny of scientific judgment.

While it is true that SEMs have the capacity to make bolder assumptions, some not discernible from experiments, (e.g., no confounding between mediator and outcome) this does not mean that investigators, acting properly, would make such assumptions when they stand contrary to scientific judgment, nor does it mean that investigators are under weaker protection from the ramifications of unwarranted assumptions. Today we know precisely which of SEM’s claims are discernible from experiments (i.e., reducible to do(x) expressions) and which are not (see Shpitser and Pearl, 2008) http://ftp.cs.ucla.edu/pub/stat_ser/r334-uai.pdf

I therefore take issue with Tyler’s statement: “SEMs themselves tend to make much stronger assumptions than these other techniques” (from his abstract) when applied to nonparametric analysis. SEMs do not make assumptions, nor do they “tend to make assumptions”; investigators do. I am inclined to believe that Tyler’s critics were aims at a specific application of SEM rather than SEM as a methodology.

Purging SEM from epidemiology would amount to purging counterfactuals from epidemiology — the latter draws its legitimacy from the former.

I also reject occasional calls to replace SEM and Causal Diagrams with weaker types of graphical models which presumably make weaker assumptions. No matter how we label alternative models (e.g., interventional graphs, agnostic graphs, causal Bayesian networks, FFRCISTG models, influence diagrams, etc.), they all must rest on judgmental assumptions and people think science (read SEM), not experiments. In other words, when an investigators asks him/herself whether an arrow from X to Y is warranted, the investigator does not ask whether an intervention on X would change the probability of Y (read: P(y|do(x)) = P(y)) but whether the function f in the mechanism y=f(x, u) depends on x for some u. Claims that the stronger assumptions made by SEMs (compared with interventional graphs) may have unintended consequences are supported by a few contrived cases where people can craft a nontrivial f(x,u) despite the equality P(y|do(x)) = P(y)). (See an example in Causality page 24.)

For a formal distinction between SEM and interventional graphs (also known as “Causal Bayes networks”, see Causality pages 23-24, 33-36). For more philosophical discussions defending counterfactuals and SEM against false alarms see:
http://ftp.cs.ucla.edu/pub/stat_ser/R269.pdf
http://ftp.cs.ucla.edu/pub/stat_ser/r393.pdf

I hope this help clarify the issue.

May 31, 2010

An Open Letter from Judea Pearl to Nancy Cartwright concerning “Causal Pluralism”

Filed under: Discussion,Nancy Cartwright,Opinion,structural equations — moderator @ 1:40 pm

Dear Nancy,

This letter concerns the issue of “causal plurality” which came up in my review of your book “Hunting Causes and Using Them” (Cambridge 2007) and in your recent reply to my review, both in recent issue of Economics and Philosophy (26:69-77, 2010).

My review:
http://journals.cambridge.org/action/displayFulltext?type=1&fid=7402268&jid=&volumeId=&issueId=&aid=7402260

Cartwright Reply:
http://journals.cambridge.org/action/displayFulltext?type=1&fid=7402292&jid=&volumeId=&issueId=&aid=7402284

I have difficulties understanding causal pluralism because I am a devout mono-theist by nature, especially when it comes to causation and, although I recognize that causes come in various shades, including total, direct, and indirect causes, necessary and sufficient causes, actual and generic causes, I have seen them all defined, analyzed and understood within a single formal framework of Structural Causal Models (SCM) as described in Causality (Chapter 7).

So, here I am, a mono-theist claiming that every query related to cause-effect relations can be formulated and answered in the SCM framework, and here you are, a pluralist, claiming exactly the opposite. Quoting:

“There are a variety of different kinds of causal systems; methods for discovering causes differ across different kinds of systems as do the inferences that can be made from causal knowledge once discovered. As to causal models, these must have different forms depending on what they are to be used for and on what kinds of systems are under study.

If causal pluralism is right, Pearl’s demand to tell economists how they ought to think about causation is misplaced; and his own are not the methods to use. They work for special kinds of problems and for special kinds of systems – those whose causal laws can be represented as Pearl represents them. HC&UT argues these are not the only kinds there are, nor uncontroversially the most typical.

I am very interested in finding out if, by committing to SCM I have not overlooked important problem areas that are not captured in SCM. But for this we need an example; i.e., an example of ONE problem that cannot be formulated and answered in SCM.

The trouble I have with the examples sited in your reply is that they are based on other examples and concepts that are scattered on many pages in your book and, thus, makes it hard to follow. Can we perhaps see one such example, hopefully with no more than 10 variables, described in the following format:

Example: An agent is facing a decision or a question.

Given: The agent assumes the following about the world: 1. 2. 3. ….
The agent has data about …., taken under the following conditions.
Needed: The agent wishes to find out whether…..

Why use this dry format, you may ask, when your book is full with dozens of imaginative examples, from physics to econometrics? Because if you succeed in showing ONE example in this concise format you will convert one heathen to pluralism, and this heathen will be grateful to you for the rest of his spiritual life.

And if he is converted, he will try and help you convert others (I promise) and, then, who knows? life on this God given earth would become so much more enlightened.

And, as Aristotle used to say (or should have) May clarity shine on causality land.

Sincerely,

Judea Pearl

August 6, 2007

SEM and Dichotomous Variables

Filed under: structural equations — moderator @ 5:22 am

David Liu writes:

In Statistics and Causal Inference: A Review (Pearl 2003), it was said 'the bulk of SEM methodology was developed for linear analysis, and until recently, no comparable methodology has been devised to extend its capabilities to models involving dichotomous variables or nonlinear dependencies.'  Is it true by now?

December 1, 2000

The causal interpretation of structural coefficients

Filed under: Book (J Pearl),structural equations — moderator @ 12:00 am

From L. H., University of Alberta and S.M., Georgia Tech 

In response to my comments (e.g., Causality, Section 5.4) that the causal interpretation of structural coefficients is practically unknown among SEM researchers, and my more recent comment that a correct causal interpretation is conspicuously absent from all SEM books and papers, including all 1970-1999 texts in economics, two readers wrote that the "unit-change" interpretation is common and well accepted in the SEM literature.

L.H. from the University of Alberta wrote:
"Page 245 of L. Hayduk, Structural Equation Modeling with LISREL: Essentials and Advances, 1986, has a chapter headed "Interpreting it All", whose first section is titled "The basics of interpretation," whose first paragraph, has a second sentence which says in italics (with notation changed to correspond to the above) that a slope can be interpreted as: the magnitude of the change in y that would be predicted to accompany a unit change in x with the other variables in the equation left untouched at their original values." … "Seems to me that O.D. Duncan, Introduction to Structural Equation Models 1975 pages 1 and 2 are pretty clear on b as causal. "More precisely, it [byx] says that a change of one unit in x … produces a change of b units in y" (page 2). I suspect that H. M. Blalock's book "Causal models in the social Sciences", and D. Heise's book "Causal analysis." probably speak of b as causal."

S.M., from Georgia Tech concurs:
"I concur with L.H. that Heise, author of Causal Analysis (1975) regarded the b of causal equations to be how much a unit change in a cause produced an effect in an effect variable. This is a well-accepted idea."

September 15, 2000

Reciprocal links in structural equations

Filed under: structural equations — moderator @ 12:00 am

From Dennis Lindley 

Equations (1.42) and (1.43) and the general issue of description by equations, still perplex me. It is incoherent to state both p(x|y) and p(y|x). (Try it with x and y binary, when these statements describe 4 values, whereas we know only 3 are needed for the joint distribution of x and y.) There are special cases, as with normal, linear regression, where the coherence is avoided. Generally I do not see how there can be two links between x and y.

April 24, 2000

Causality and the mystical error terms

Filed under: General,structural equations — moderator @ 12:00 am

From David Kenny (University of Connecticut) 

Let me just say that it is very gratifying to see a philosopher give the problem of causality some serious attention. Moreover, you discuss the concept as it used in contemporary social sciences. I have bothered by the fact that all too many social scientist try to avoid saying "cause" when that is clearly what they mean to say. Thank you!

I have not finished your book, but I cannot resist making one point to you. In 5.4, you discuss the meaning of structural coefficients, but you spend a good deal of time discussing the meaning of epsilon or e. It seems to me that e has a very straight-forward meaning in SEM. If the true equation for y is

y = Bx + Cz + Dq + etc + r where is r is meant to allow for some truly random component, then e = Cz + Dq + etc + r or the sum of the omitted variables. The difficulty in SEM is that usually, though not always, for identification purposes it must be assumed that e and x have a zero correlation. Perhaps this is the standard "omitted variables" explanation of e that you allude to, but it does not seem at all mysterious, at least to me.

« Previous Page

Powered by WordPress