Causal Analysis in Theory and Practice

January 4, 2023

Causal Inference (CI) − A year in review

Filed under: Causal models,Counterfactuals,Econometrics,Imbens,Simpson's Paradox,structural equations — judea @ 10:55 am
2022 has witnessed a major upsurge in the status of CI, primarily in its general recognition as an independent and essential component in every aspect of intelligent decision making. Visible evidence of this recognition were several prestigious prizes awarded explicitly to CI-related research accomplishments. These include (1) the Nobel Prize in economics, awarded to David Card, Joshua Angrist, and Guido Imbens for their works on cause and effect relations in natural experiments https://www.nobelprize.org/prizes/economic-sciences/2021/press-release/ (2) The BBVA Frontiers of Knowledge Award to Judea Pearl for “laying the foundations of modern AI” https://www.eurekalert.org/news-releases/942893 and (3) The Rousseeuw Prize for Statistics to Jamie Robins, Thomas Richardson, Andrea Rotnitzky, Miguel Hernán, and Eric Tchetchgen Tchetchgen, for their “pioneering work on Causal Inference with applications in Medicine and Public Health” https://www.rousseeuwprize.org/news/winners-2022.
w
My acceptance speech at the BBVA award can serve as a gentle summary of the essence of causal inference, its basic challenges and major achievements: https://www.youtube.com/watch?v=uaq389ckd5o.
 
It is not a secret that I have been critical of the approach Angrist and Imbens are taking in econometrics, for reasons elaborated here https://ucla.in/2FwdsGV, and mainly here https://ucla.in/36EoNzO. I nevertheless think that their selection to receive the Nobel Prize in economics is a positive step for CI, in that it calls public attention to the problems that CI is trying to solve and will eventually inspire curious economists to seek a more broad-minded approach to these problems, so as to leverage the full arsenal of tools that CI has developed.
 
Coupled with these highlights of recognition, 2022 has seen a substantial increase in CI activities on both the academic and commercial fronts. The number of citations to CI related articles has reached a record high of over 10,200 citations in 2022, https://scholar.google.com/citations?user=bAipNH8AAAAJ&hl=en , showing positive derivatives in all CI categories. Dozens, if not hundreds of seminars, workshops and symposia have been organized in major conferences to disseminate progress in CI research. New results on individualized decision making were prominently featured in these meetings (e.g., https://ucla.in/33HSkNI). Several commercial outfits have come up with platforms for CI in their areas of specialization, ranging from healthcare to finance and marketing. (Company names such as #causallense, and Vianai Systems come to mind:
https://www.causalens.com/startup-series-a-funding-round-45-million/, https://arxiv.org/ftp/arxiv/papers/2207/2207.01722.pdf). Naturally, these activities have led to increasing demands for trained researchers and educators, versed in the tools of CI; jobs openings explicitly requiring experience in CI have become commonplace in both industry and academia.
 
I am also happy to see CI becoming an issue of contention in AI and Machine Learning (ML), increasingly recognized as an essential capability for human-level AI and, simultaneously, raising the question of whether the data-fitting methodologies of Big Data and Deep Learning could ever acquire these capabilities. In https://ucla.in/3d2c2Fi I’ve answered this question in the negative, though various attempts to dismiss CI as a species of “inductive bias” (e.g., https://www.youtube.com/watch?v=02ABljCu5Zw) or “missing data problem” (e.g., https://www.jstor.org/stable/pdf/26770992.pdf) are occasionally being proposed as conceptualizations that could potentially replace the tools of CI. The Ladder of Causation tells us what extra-data information would be required to operationalize such metaphorical aspirations.
 
Researchers seeking a gentle introduction to CI are often attracted to multi-disciplinary forums or debates, where basic principles are compiled and where differences and commonalities among various approaches are compared and analyzed by leading researchers. Not many such forums were published in 2022, perhaps because the differences and commonalities are now well understood or, as I tend to believe, CI and its Structural Causal Model (SCM) unifies and embraces all other approaches. I will describe two such forums in which I participated.
 
(1) In March of 2022, the Association for Computing Machinery (ACM) has published an anthology containing highlights of my works (1980-2020) together with commentaries and critics from two dozens authors, representing several disciplines. The Table of Content can be seen here: https://ucla.in/3hLRWkV. It includes 17 of my most popular papers, annotated for context and scope, followed by 17 contributed articles of colleagues and critics. The ones most relevant to CI in 2022 are in Chapters 21-26.
 
Among these, I consider the causal resolution of Simpson’s paradox (Chapter 22, https://ucla.in/2Jfl2VS) to be one of the crown achievements of CI. The paradox lays bare the core differences between causal and statistical thinking, and its resolution brings an end to a century of debates and controversies by the best philosophers of our time. It is also related to Lord’s Paradox (see https://ucla.in/2YZjVFL) − a qualitative version of Simpson’s Paradox which became a focus of endless debates with statisticians and trialists throughout 2022 (on Twitter @yudapearl). I often cite Simpson’s paradox as a proof that our brain is governed by causal, not statistical, calculus.
 
This question − causal or statistical brain − is not a cocktail party conversation but touches on the practical question of choosing an appropriate language for casting the knowledge necessary for commencing any CI exercise. Philip Dawid − a proponent of counterfactual-free statistical languages − has written a critical essay on the topic (https://www.degruyter.com/document/doi/10.1515/jci-2020-0008/html?lang=en) and my counterfactual-based rebuttal, https://ucla.in/3bXCBy3, clarifies the issues involved.
 
(2) The second forum of inter-disciplinary discussions can be found in a special issue of the Journal Observational Studies, https://muse.jhu.edu/pub/56/article/867085/pdf (edited by Ian Shrier, Russell Steele, Tibor Schuster and Mireille Schnitzer) in a form of interviews with Don Rubin, Jamie Robins, James Heckman and myself.
 
In my interview, https://ftp.cs.ucla.edu/pub/stat_ser/r523.pdf, I compiled aspects of CI that I normally skip in scholarly articles. These include historical perspectives of the development of CI, its current state of affairs and, most importantly for our purpose, the lingering differences between CI and other frameworks. I believe that this interview provides a fairly concise summary of these differences, which have only intensified in 2022.
 
Most disappointing to me are the graph-avoiding frameworks of Rubin, Angrist, Imbens and Heckman, which still dominate causal analysis in economics and some circles of statistics and social science. The reasons for my disappointments are summarized in the following paragraph:
Graphs are new mathematical objects, unfamiliar to most researchers in the statistical sciences, and were of course rejected as “non-scientific ad-hockery” by top leaders in the field [Rubin, 2009]. My attempts to introduce causal diagrams to statistics [Pearl, 1995; Pearl, 2000] have taught me that inertial forces play at least as strong a role in science as they do in politics. That is the reason that non-causal mediation analysis is still practiced in certain circles of social science [Hayes, 2017], “ignorability” assumptions still dominate large islands of research [Imbens and Rubin, 2015], and graphs are still tabooed in the econometric literature [Angrist and Pischke, 2014]. While most researchers today acknowledge the merits of graph as a transparent language for articulating scientific information, few appreciate the computational role of graphs as “reasoning engines,” namely, bringing to light the logical ramifications of the information used in their construction. Some economists even go to great pains to suppress this computational miracle [Heckman and Pinto, 2015; Pearl, 2013].
 
My disagreements with Heckman go back to 2007 when he rejected the do-operator for metaphysical reasons (see https://ucla.in/2NnfGPQ#page=44) and then to 2013, when he celebrated the do-operator after renaming it “fixing” but remained in denial of d-separation (see https://ucla.in/2L8OCyl). In this denial he retreated 3 decades in time while castrating graphs from their inferential power. Heckman’s 2022 interview in Observational Studies continues his on-going crusade to prove that econometrics has nothing to learn from neighboring fields. His fundamental mistake lies in assuming that the rules of do-calculus lie “outside of formal statistics”; they are in fact logically derivable from formal statistics, REGARDLESS of our modeling assumptions but (much like theorems in geometry) once established, save us the labor of going back to the basic axioms.
 
My differences with Angrist, Imbens and Rubin go even deeper (see https://ucla.in/36EoNzO), for they involve not merely the avoidance of graphs but also the First Law of Causal Inference (https://ucla.in/2QXpkYD) hence issues of transparency and credibility. These differences are further accentuated in Imbens’s Nobel lecture https://onlinelibrary.wiley.com/doi/pdf/10.3982/ECTA21204 which treats CI as a computer science creation, irrelevant to “credible” econometric research. In https://ucla.in/2L8OCyl, as well as in my book Causality, I present dozens of simple problems that economists need, but are unable to solve, lacking the tools of CI.
 
It is amazing to watch leading researchers, in 2022, still resisting the benefits of CI while committing their respective fields to the tyranny of outdatedness.
 
To summarize, 2022 has seen an unprecedented upsurge in CI popularity, activity and stature. The challenge of harnessing CI tools to solve critical societal problems will continue to inspire creative researchers from all fields, and the aspirations of advancing towards human-level artificial intelligence will be pursued with an accelerated pace in 2023.

Wishing you a productive new year,
Judea


Comments (0)

July 6, 2020

Race, COVID Mortality, and Simpson’s Paradox (by Dana Mackenzie)

Filed under: Simpson's Paradox — judea @ 1:11 pm

Summary

This post reports on the presence of Simpson’s paradox in the latest CDC data on coronavirus. At first glance, the data may seem to support the notion that coronavirus is especially dangerous to white, non-Hispanic people. However, when we take into account the causal structure of the data, and most importantly we think about what causal question we want to answer, the conclusion is quite different. This gives us an opportunity to emphasize a point that was perhaps not stressed enough in The Book of Why, namely that formulation of the right query is just as important as constructing the right causal model.

Race, COVID Mortality, and Simpson’s Paradox

Recently I was perusing the latest data on coronavirus on the Centers for Disease Control (CDC) website. When I got to the two graphs shown below, I did a double-take.

(click on the graph to enlarge)

COVID-19 Cases and Deaths by Race and Ethnicity (CDC, 6/30/2020).

This is a lot to take in, so let me point out what shocked me. The first figure shows that 35.3 percent of diagnosed COVID cases were in “white, non-Hispanic” people. But 49.5 percent of COVID deaths occurred to people in this category. In other words, whites who have been diagnosed as COVID-positive have a 40 percent greater risk of death than non-whites or Hispanics who have been diagnosed as COVID-positive.

This, of course, is the exact opposite of what we have been hearing in the news media. (For example, Graeme Wood in The Atlantic: “Black people die of COVID-19 at a higher rate than white people do.”) Have we been victimized by a media deception? The answer is NO, but the explanation underscores the importance of understanding the causal structure of data and interrogating that data using properly phrased causal queries.

Let me explain, first, why the data above cannot be taken at face value. The elephant in the room is age, which is the single biggest risk factor for death due to COVID-19. Let’s look at the CDC mortality data again, but this time stratifying by age group.

Race →

White, non-Hispanic

Others

Age ↓

Cases

Deaths

Cases

Deaths

0-4

23.9%

53.3%

76.1%

46.7%

5-17

19%

9.1%

81%

90.9%

18-29

29.8%

18.9%

70.2%

81.1%

30-39

26.5%

16.4%

73.5%

83.6%

40-49

26.5%

16.4%

73.5%

83.6%

50-64

36.4%

16.4%

63.6%

83.6%

65-74

45.9%

40.8%

54.1%

59.2%

75-84

55.4%

52.1%

44.6%

47.9%

85+

69.6%

67.6%

30.4%

32.4%

ALL AGES

35.4%

49.5%

64.6%

50.5%

This table shows us that in every age category (except ages 0-4), whites have a lower case fatality rate than non-whites. That is, whites make up a lower percentage of deaths than cases. But when we aggregate all of the ages, whites have a higher fatality rate. The reason is simple: whites are older.

According to U.S. census data (not shown here), 9 percent of the white population in the United States is over age 75. By comparison, only 4 percent of Black people and 3 percent of Hispanic people have reached the three-quarter-century mark. People over age 75 are exactly the ones who are at greatest risk of dying from COVID (and by a wide margin). Thus the white population contains more than twice as many high-risk people as the Black population, and three times as many high-risk people as the Hispanic population.

People who have taken a course in statistics may recognize the phenomenon we have uncovered here as Simpson’s paradox. To put it most succinctly, and most paradoxically, if you tell me that you are white and COVID-positive, but do not tell me your age, I have to assume you have a higher risk of dying than your neighbor who is Black and COVID-positive. But if you do tell me your age, your risk of dying becomes less than your neighbor who is Black and COVID-positive and the same age. How can that be? Surely the act of telling me your age should not make any difference to your medical condition.

In introductory statistics courses, Simpson’s paradox is usually presented as a curiosity, but the COVID data shows that it raises a fundamental question. Which is a more accurate picture of reality? The one where I look only at the aggregate data and conclude that whites are at greater risk of dying, or the one where I break the data down by age and conclude that non-whites are at greater risk?

The general answer espoused by introductory statistics textbooks is: control for everything. If you have age data, stratify by age. If you have data on underlying medical conditions, or socioeconomic status, or anything else, stratify by those variables too.

This “one-size-fits-all” approach is misguided because it ignores the causal story behind the data. In The Book of Why, we look at a fictional example of a drug that is intended to prevent heart attacks by lowering blood pressure. We can summarize the causal story in a diagram:

Here blood pressure is what we call a mediator, an intervening variable through which the intervention produces its effect. We also allow for the possibility that the drug may directly influence the chances of a heart attack in other, unknown ways, by drawing an arrow directly from “Drug” to “Heart Attack.”

The diagram tells us how to interrogate the data. Because we want to know the drug’s total effect on the patient, through the intended route as well as other, unintended routes, we should not stratify the data. That is, we should not separate the experimental data into “high-blood-pressure” and “low-blood-pressure” groups. In our book, we give (fictitious) experimental data in which the drug increases the risk of heart attack among people in the low-blood-pressure group and among people in the high-blood-pressure group (presumably because of side effects). But at the same time, and most importantly, it shifts patients from the high-risk high-blood-pressure group into the low-risk low-blood-pressure group. Thus its total effect is beneficial, even though its effect on each stratum appears to be harmful.

It’s interesting to compare this fictitious example to the all-too-real COVID example, which I would argue has a very similar causal structure:

The causal arrow from “race” to “age” means that your race influences your chances of living to age 75 or older. In this diagram, Age is a mediator between Race and Death from COVID; that is, it is a mechanism through which Race acts. As we saw in the data, it’s quite a potent mechanism; in fact, it accounts for why white people who are COVID-positive die more often.

Because the two causal diagrams are the same, you might think that in the second case, too, we should not stratify the data; instead we should use the aggregate data and conclude that COVID is a disease that “discriminates” against whites.

However, this argument ignores the second key ingredient I mentioned earlier: interrogating the data using correctly phrased causal queries.

What is our query in this case? It’s different from what it was in the drug example. In that case, we were looking at the drug as a preventative for a heart attack. If we were to look at the COVID data in the same way, we would ask, “What is the total lifetime effect of intervening (before birth) to change a person’s race?” And yes: if we could perform that intervention, and if our sole objective was to prevent death from COVID, we would choose to change our race from white to non-white. The “benefit” of that intervention would be that we would never live to an age where we were at high risk of dying from COVID.

I’m sure you can see, without my even explaining it, that this is not the query any reasonable person would pose. “Saving” lives from COVID by making them end earlier for other reasons is not a justifiable health policy.

Thus, the query we want to interrogate the data with is not “What is the total effect?” but “What is the direct effect?” As we explain on page 312 of The Book of Why, this is always the query we are interested in when we talk about discrimination. If we want to know whether our health-care system discriminates against a certain ethnic group, then we want to hold all other variables constant that might account for the outcome, and see what is the effect of changing Race alone. In this case, that means stratifying the data by Age, and the result is that we do see evidence of discrimination. Non-whites do worse at (almost) every age. As Wood writes, “The virus knows no race or nationality; it can’t peek at your driver’s license or census form to check whether you are black. Society checks for it, and provides the discrimination on the virus’s behalf.”

To reiterate: The causal story here is identical to the Drug-Blood Pressure-Heart Attack example. What has changed is our query. Precision is required both in formulating the causal model, and in deciding what is the question we want to ask of it.

I wanted to place special emphasis on the query because I recently was asked to referee an article about Simpson’s paradox that missed this exact point. Of course I cannot tell you more about the author or the journal. (I don’t even know who the author is.) It was a good article overall, and I hope that it will be published with a suitable revision. 

In the meantime, there is plenty of room for further exploration of the coronavirus epidemic with causal models. Undoubtedly the diagram above is too simple; unfortunately, if we make it more realistic by including more variables, we may not have any data available to interrogate. In fact, even in this case there is a huge amount of missing data: 51 percent of the COVID cases have unknown race/ethnicity, and 19 percent of the deaths. Thus, while we can learn an excellent lesson about Simpson’s paradox and some probable lessons about racial inequities, we have to present the results with some caution. Finally, I would like to draw attention to something curious in the CDC data: The case fatality rate for whites in the youngest age group, ages 0-4, is much higher than for non-whites. I don’t know how to explain this, and I would think that someone with an interest in pediatric COVID cases should investigate.


Comments (7)

June 15, 2018

A Statistician’s Re-Reaction to The Book of Why

Filed under: Book (J Pearl),Discussion,Simpson's Paradox — Judea Pearl @ 2:29 am

Responding to my June 11 comment, Kevin Gray posted a reply on kdnuggets.com in which he doubted the possibility that the Causal Revolution has solved problems that generations of statisticians and philosophers have labored over and could not solve. Below is my reply to Kevin’s Re-Reaction, which I have also submitted to kdhuggets.com:

Dear Kevin,
I am not suggesting that you are only superficially acquainted with my works. You actually show much greater acquaintance than most statisticians in my department, and I am extremely appreciative that you are taking the time to comment on The Book of Why. You are showing me what other readers with your perspective would think about the Book, and what they would find unsubstantiated or difficult to swallow. So let us go straight to these two points (i.e., unsubstantiated and difficult to swallow) and give them an in-depth examination.

You say that I have provided no evidence for my claim: “Even today, only a small percentage of practicing statisticians can solve any of the causal toy problems presented in the Book of Why.” I believe that I did provide such evidence, in each of the Book’s chapters, and that the claim is valid once we agree on what is meant by “solve.”

Let us take the first example that you bring, Simpson’s paradox, which is treated in Chapter 6 of the Book, and which is familiar  to every red-blooded statistician. I characterized the paradox in these words: “It has been bothering statisticians for more than sixty years – and it remains vexing to this very day” (p. 201). This was, as you rightly noticed, a polite way of saying: “Even today, the vast majority of statisticians cannot solve Simpson’s paradox,” a fact which I strongly believe to be true.

You find this statement hard to swallow, because: “generations of researchers and statisticians have been trained to look out for it [Simpson’s Paradox]” an observation that seems to contradict my claim. But I beg you to note that “trained to look out for it” does not make the researchers capable of “solving it,” namely capable of deciding what to do when the paradox shows up in the data.

This distinction appears vividly in the debate that took place in 2014 on the pages of The American Statistician, which you and I cite.  However, whereas you see the disagreements in that debate as evidence that statisticians have several ways of resolving Simpson’s paradox, I see it as evidence that they did not even come close. In other words, none of the other participants presented a method for deciding whether the aggregated data or the segregated data give the correct answer to the question: “Is the treatment helpful or harmful?”

Please pay special attention to the article by Keli Liu and Xiao-Li Meng, both are from Harvard’s department of statistics (Xiao-Li is a senior professor and a Dean), so they cannot be accused of misrepresenting the state of statistical knowledge in 2014. Please read their paper carefully and judge for yourself whether it would help you decide whether treatment is helpful or not, in any of the examples presented in the debate.

It would not!! And how do I know? I am listening to their conclusions:

  1. They disavow any connection to causality (p.18), and
  2. They end up with the wrong conclusion. Quoting: “less conditioning is most likely to lead to serious bias when Simpson’s Paradox appears.” (p.17) Simpson himself brings an example where conditioning leads to more bias, not less.

I dont blame Liu and Meng for erring on this point, it is not entirely their fault (Rosenbaum and Rubin made the same error). The correct solution to Simpson’s dilemma rests on the back-door criterion, which is almost impossible to articulate without the aid of DAGs. And DAGs, as you are probably aware, are forbidden from entering a 5 mile no-fly zone around Harvard [North side, where the statistics department is located].

So, here we are. Most statisticians believe that everyone knows how to “watch for” Simpson’s paradox, and those who seek an answer to: “Should we treat or not?” realize that “watching” is far from “solving.” Moreover, the also realize that there is no solution without stepping outside the comfort zone of statistical analysis and entering the forbidden city of causation and graphical models.

One thing I do agree with you — your warning about the implausibility of the Causal Revolution. Quoting: “to this day, philosophers disagree about what causation is, thus to suggest he has found the answer to it is not plausible”.  It is truly not plausible that someone, especially a semi-outsider, has found a Silver Bullet. It is hard to swallow. That is why I am so excited about the Causal Revolution and that is why I wrote the book. The Book does not offer a Silver Bullet to every causal problem in existence, but it offers a solution to a class of problems that centuries of statisticians and Philosophers tried and could not crack. It is implausible, I agree, but it happened. It happened not because I am smarter but because I took Sewall Wright’s idea seriously and milked it to its logical conclusions as much as I could.

It took quite a risk on my part to sound pretentious and call this development a Causal Revolution. I thought it was necessary. Now I am asking you to take a few minutes and judge for yourself whether the evidence does not justify such a risky characterization.

It would be nice if we could alert practicing statisticians, deeply invested in the language of statistics to the possibility that paradigm shifts can occur even in the 21st century, and that centuries of unproductive debates do not make such shifts impossible.

You were right to express doubt and disbelief in the need for a paradigm shift, as would any responsible scientist in your place. The next step is to let the community explore:

  1. How many statisticians can actually answer Simpson’s question, and
  2. How to make that number reach 90%.

I believe The Book of Why has already doubled that number, which is some progress. It is in fact something that I was not able to do in the past thirty years through laborious discussions with the leading statisticians of our time.

It is some progress, let’s continue,
Judea

Comments (4)

August 24, 2016

Simpson’s Paradox: The riddle that would not die. (Comments on four recent papers)

Filed under: Simpson's Paradox — bryantc @ 12:06 am

Contributor: Judea Pearl

If you search Google for “Simpson’s paradox,” as I did yesterday, you will get 111,000 results, more than any other statistical paradox that I could name. What elevates this innocent reversal of association to “paradoxical” status, and why it has captured the fascination of statisticians, mathematicians and philosophers for over a century are questions that we discussed at length on this (and other) blogs. The reason I am back to this topic is the publication of four recent papers that give us a panoramic view at how the understanding of causal reasoning has progressed in communities that do not usually participate in our discussions.

As readers of this blog recall, I have been trying since the publication of Causality (2000) to convince statisticians, philosophers and other scientific communities that Simpson’s paradox is: (1) a product of wrongly applied causal principles, and (2) that it can be fully resolved using modern tools of causal inference.

The four papers to be discussed do not fully agree with the proposed resolution.

To reiterate my position, Simpson’s paradox is (quoting Lord Russell) “another relic of a bygone age,” an age when we believed that every peculiarity in the data can be understood and resolved by statistical means. Ironically, Simpson’s paradox has actually become an educational tool for demonstrating the limits of statistical methods, and why causal, rather than statistical considerations are necessary to avoid paradoxical interpretations of data. For example, our recent book Causal Inference in Statistics: A Primer, uses Simpson’s paradox at the very beginning (Section 1.1), to show students the inevitability of causal thinking and the futility of trying to interpret data using statistical tools alone. See http://bayes.cs.ucla.edu/PRIMER/.

Thus, my interest in the four recent articles stems primarily from curiosity to gauge the penetration of causal ideas into communities that were not intimately involved in the development of graphical or counterfactual models. Discussions of Simpson’s paradox provide a sensitive litmus test to measure the acceptance of modern causal thinking. “Talk to me about Simpson,” I often say to friendly colleagues, “and I will tell you how far you are on the causal trail.” (Unfriendly colleagues balk at the idea that there is a trail they might have missed.)

The four papers for discussion are the following:

1.
Malinas, G. and Bigelow, J. “Simpson’s Paradox,” The Stanford Encyclopedia of Philosophy (Summer 2016 Edition), Edward N. Zalta (ed.), URL = <http://plato.stanford.edu/archives/sum2016/entries/paradox-simpson/>.

2.
Spanos, A., “Revisiting Simpson’s Paradox: a statistical misspecification perspective,” ResearchGate Article, <https://www.researchgate.net/publication/302569325>, online May 2016.
<http://arxiv.org/pdf/1605.02209v2.pdf>.

3.
Memetea, S. “Simpson’s Paradox in Epistemology and Decision Theory,” The University of British Columbia (Vancouver), Department of Philosophy, Ph.D. Thesis, May 2015.
https://open.library.ubc.ca/cIRcle/collections/ubctheses/24/items/1.0167719

4.
Bandyopadhyay, P.S., Raghavan, R.V., Deruz, D.W., and Brittan, Jr., G. “Truths about Simpson’s Paradox Saving the Paradox from Falsity,” in Mohua Banerjee and Shankara Narayanan Krishna (Eds.), Logic and Its Applications, Proceedings of the 6th Indian Conference ICLA 2015 , LNCS 8923, Berlin Heidelberg: Springer-Verlag, pp. 58-73, 2015 .
https://www.academia.edu/11600189/Truths_about_Simpson_s_Paradox_Saving_the_Paradox_from_Falsity

——————- Discussion ——————-

1. Molina and Bigelow 2016 (MB)

I will start the discussion with Molina and Bigelow 2016 (MB) because the Stanford Encyclopedia of Philosophy enjoys both high visibility and an aura of authority. MB’s new entry is a welcome revision of their previous article (2004) on “Simpson’s Paradox,” which was written almost entirely from the perspective of “probabilistic causality,” echoing Reichenbach, Suppes, Cartwright, Good, Hesslow, Eells, to cite a few.

Whereas the previous version characterizes Simpson’s reversal as “A Logically Benign, empirically Treacherous Hydra,” the new version dwarfs the dangers of that Hydra and correctly states that Simpson’s paradox poses problem only for “philosophical programs that aim to eliminate or reduce causation to regularities and relations between probabilities.” Now, since the “probabilistic causality” program is fairly much abandoned in the past two decades, we can safely conclude that Simpson’s reversal poses no problem to us mortals. This is reassuring.

MB also acknowledge the role that graphical tools play in deciding whether one should base a decision on the aggregate population or on the partitioned subpopulations, and in testing one’s hypothesized model.

My only disagreement with the MB’s article is that it does not go all the way towards divorcing the discussion from the molds, notation and examples of the “probabilistic causation” era and, naturally, proclaim the paradox “resolved.” By shunning modern notation like do(x), Yx, or their equivalent, the article gives the impression that Bayesian conditionalization, as in P(y|x), is still adequate for discussing Simpson’s paradox, its ramifications and its resolution. It is not.

In particular, this notational orthodoxy makes the discussion of the Sure Thing Principle (STP) incomprehensible and obscures the reason why Simpson’s reversal does not constitute a counter example to STP. Specifically, it does not tell readers that causal independence is a necessary condition for the validity of the STP, (i.e., actions should not change the size of the subpopulations) and this independence is violated in the counterexample that Blyth contrived in 1972. (See http://ftp.cs.ucla.edu/pub/stat_ser/r466-reprint.pdf.)

I will end with a humble recommendation to the editors of the Stanford Encyclopedia of Philosophy. Articles concerning causation should be written in a language that permits authors to distinguish causal from statistical dependence. I am sure future authors in this series would enjoy the freedom of saying “treatment does not change gender,” something they cannot say today, using Bayesian conditionalization. However, they will not do so on their own, unless you tell them (and their reviewers) explicitly that it is ok nowadays to deviate from the language of Reichenbach and Suppes and formally state: P(gender|do(treatment)) = P(gender).

Editorial guidance can play an incalculable role in the progress of science.

2. Comments on Spanos (2016)

In 1988, the British econometrician John Denis Sargan gave the following definition of an “economic model”: “A model is the specification of the probability distribution for a set of observations. A structure is the specification of the parameters of that distribution.” (Lectures on Advanced Econometric Theory (1988, p.27))

This definition, still cited in advanced econometric books (e.g., Cameron and Trivdi (2009) Microeconometrics) has served as a credo to a school of economics that has never elevated itself from the data-first paradigm of statistical thinking. Other prominent leaders of this school include Sir David Hendry, who wrote: “The joint density is the basis: SEMs (Structural Equation Models) are merely an interpretation of that.” Members of this school are unable to internalize the hard fact that statistics, however refined, cannot provide the information that economic models must encode to be of use to policy making. For them, a model is just a compact encoding of the density function underlying the data, so, two models encoding the same density function are deemed interchangeable.

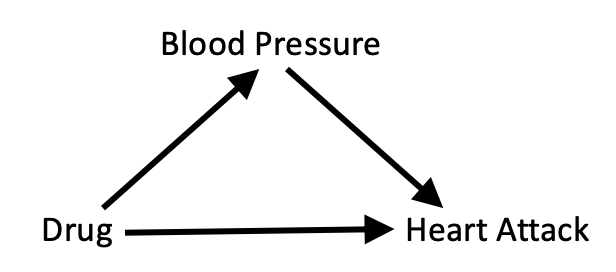
Spanos article is a vivid example of how this statistics-minded culture copes with causal problems. Naturally, Spanos attributes the peculiarities of Simpson’s reversal to what he calls “statistical misspecification,” not to causal shortsightedness. “Causal” relationships do not exist in the models of Sargan’s school, so, if anything goes wrong, it must be “statistical misspecification,” what else? But what is this “statistical misspecification” that Spanos hopes would allow him to distinguish valid from invalid inference? I have read the paper several times, and for the life of me, it is beyond my ability to explain how the conditions that Spanos posits as necessary for “statistical adequacy” have anything to do with Simpson’s paradox. Specifically, I cannot see how “misspecified” data, which wrongly claims: “good for men, good for women, bad for people” suddenly becomes “well-specified” when we replace “gender” with “blood pressure”.

Spanos’ conditions for “statistical adequacy” are formulated in the context of the Linear Regression Model and invoke strictly statistical notions such as normality, linearity, independence etc. None of them applies to the binary case of {treatment, gender, outcome} in which Simpson’s paradox is usually cast. I therefore fail to see why replacing “gender” with “blood pressure” would turn an association from “spurious” to “trustworthy”.

Perhaps one of our readers can illuminate the rest of us how to interpret this new proposal. I am at a total loss.

For fairness, I should add that most economists that I know have second thoughts about Sargan’s definition, and claim to understand the distinction between structural and statistical models. This distinction, unfortunately, is still badly missing from econometric textbooks, see http://ftp.cs.ucla.edu/pub/stat_ser/r395.pdf I am sure it will get there some day; Lady Science is forgiving, but what about economics students?

3. Memetea (2015)

Among the four papers under consideration, the one by Memetea, is by far the most advanced, comprehensive and forward thinking. As a thesis written in a philosophy department, Memetea treatise is unique in that it makes a serious and successful effort to break away from the cocoon of “probabilistic causality” and examines Simpson’s paradox to the light of modern causal inference, including graphical models, do-calculus, and counterfactual theories.

Memetea agrees with our view that the paradox is causal in nature, and that the tools of modern causal analysis are essential for its resolution. She disagrees however with my provocative claim that the paradox is “fully resolved”. The areas where she finds the resolution wanting are mediation cases in which the direct effect (DE) differs in sign from the total effect (TE). The classical example of such cases (Hesslow 1976) tells of a birth control pill that is suspected of producing thrombosis in women and, at the same time, has a negative indirect effect on thrombosis by reducing the rate of pregnancies (pregnancy is known to encourage thrombosis).

I have always argued that Hesslow’s example has nothing to do with Simpson’s paradox because it compares apples and oranges, namely, it compare direct vs. total effects where reversals are commonplace. In other words, Simpson’s reversal evokes no surprise in such cases. For example, I wrote, “we are not at all surprised when smallpox inoculation carries risks of fatal reaction, yet reduces overall mortality by irradicating smallpox. The direct effect (fatal reaction) in this case is negative for every subpopulation, yet the total effect (on mortality) is positive for the population as a whole.” (Quoted from http://ftp.cs.ucla.edu/pub/stat_ser/r436.pdf) When a conflict arises between the direct and total effects, the investigator need only decide what research question represents the practical aspects of the case in question and, once this is done, the appropriate graphical tools should be invoked to properly assess DE or TE. [Recall, complete algorithms are available for both, going beyond simple adjustment, and extending to other counterfactually defined effects (e.g., ETT, causes-of-effect, and more).]

Memetea is not satisfied with this answer. Her condition for resolving Simpson’s paradox requires that the analyst be told whether it is the direct or the total effect that should be the target of investigation. This would require, of course, that the model includes information about the investigator’s ultimate aims, whether alternative interventions are available (e.g. to prevent pregnancy), whether the study result will be used by a policy maker or a curious scientist, whether legal restrictions (e.g., on sex discrimination) apply to the direct or the total effect, and so on. In short, the entire spectrum of scientific and social knowledge should enter into the causal model before we can determine, in any given scenario, whether it is the direct or indirect effect that warrants our attention.

This is a rather tall order to satisfy given that our investigators are fairly good in determining what their research problem is. It should perhaps serve as a realizable goal for artificial intelligence researchers among us, who aim to build an automated scientist some day, capable of reasoning like our best investigators. I do not believe though that we need to wait for that day to declare Simpson’s paradox “resolved”. Alternatively, we can declare it resolved modulo the ability of investigators to define their research problems.

4. Comments on Bandyopadhyay, etal (2015)

There are several motivations behind the resistance to characterize Simpson’s paradox as a causal phenomenon. Some resist because causal relationships are not part of their scientific vocabulary, and some because they think they have discovered a more cogent explanation, which is perhaps easier to demonstrate or communicate.

Spanos’s article represents the first group, while Bandyopadhyay etal’s represents the second. They simulated Simpson’s reversal using urns and balls and argued that, since there are no interventions involved in this setting, merely judgment of conditional probabilities, the fact that people tend to make wrong judgments in this setting proves that Simpson’s surprise is rooted in arithmetic illusion, not in causal misinterpretation.

I have countered this argument in http://ftp.cs.ucla.edu/pub/stat_ser/r414.pdf and I think it is appropriate to repeat the argument here.

“In explaining the surprise, we must first distinguish between ‘Simpson’s reversal’ and ‘Simpson’s paradox’; the former being an arithmetic phenomenon in the calculus of proportions, the latter a psychological phenomenon that evokes surprise and disbelief. A full understanding of Simpson’s paradox should explain why an innocent arithmetic reversal of an association, albeit uncommon, came to be regarded as `paradoxical,’ and why it has captured the fascination of statisticians, mathematicians and philosophers for over a century (though it was first labeled ‘paradox’ by Blyth (1972)) .

“The arithmetics of proportions has its share of peculiarities, no doubt, but these tend to become objects of curiosity once they have been demonstrated and explained away by examples. For instance, naive students of probability may expect the average of a product to equal the product of the averages but quickly learn to guard against such expectations, given a few counterexamples. Likewise, students expect an association measured in a mixture distribution to equal a weighted average of the individual associations. They are surprised, therefore, when ratios of sums, (a+b)/(c+d), are found to be ordered differently than individual ratios, a/c and b/d.1 Again, such arithmetic peculiarities are quickly accommodated by seasoned students as reminders against simplistic reasoning.

“In contrast, an arithmetic peculiarity becomes ‘paradoxical’ when it clashes with deeply held convictions that the peculiarity is impossible, and this occurs when one takes seriously the causal implications of Simpson’s reversal in decision-making contexts.  Reversals are indeed impossible whenever the third variable, say age or gender, stands for a pre-treatment covariate because, so the reasoning goes, no drug can be harmful to both males and females yet beneficial to the population as a whole. The universality of this intuition reflects a deeply held and valid conviction that such a drug is physically impossible.  Remarkably, such impossibility can be derived mathematically in the calculus of causation in the form of a ‘sure-thing’ theorem (Pearl, 2009, p. 181):

‘An action A that increases the probability of an event B in each subpopulation (of C) must also increase the probability of B in the population as a whole, provided that the action does not change the distribution of the subpopulations.’2

“Thus, regardless of whether effect size is measured by the odds ratio or other comparisons, regardless of whether Z  is a confounder or not, and regardless of whether we have the correct causal structure on hand, our intuition should be offended by any effect reversal that appears to accompany the aggregation of data.

“I am not aware of another condition that rules out effect reversal with comparable assertiveness and generality, requiring only that Z not be affected by our action, a requirement satisfied by all treatment-independent covariates Z. Thus, it is hard, if not impossible, to explain the surprise part of Simpson’s reversal without postulating that human intuition is governed by causal calculus together with a persistent tendency to attribute causal interpretation to statistical associations.”

1. In Simpson’s paradox we witness the simultaneous orderings: (a1+b1)/(c1+d1)> (a2+b2)/(c2+d2), (a1/c1)< (a2/c2), and (b1/d1)< (b2/d2)
2. The no-change provision is probabilistic; it permits the action to change the classification of individual units so long as the relative sizes of the subpopulations remain unaltered.


Final Remarks

I used to be extremely impatient with the slow pace in which causal ideas have been penetrating scientific communities that are not used to talk cause-and-effect. Recently, however, I re-read Thomas Kuhn’ classic The Structure of Schientific Revolution and I found there a quote that made me calm, content, even humorous and hopeful. Here it is:

—————- Kuhn —————-

“The transfer of allegiance from paradigm to paradigm is a conversion experience that cannot be forced. Lifelong resistance, particularly from those whose productive careers have committed them to an older tradition of normal science, is not a violation of scientific standards but an index to the nature of scientific research itself.”
p. 151

“Conversions will occur a few at a time until, after the last holdouts have died, the whole profession will again be practicing under a single, but now a different, paradigm.”
p. 152

We are now seeing the last holdouts.

Cheers,

Judea


Addendum: Simpson and the Potential-Outcome Camp

My discussion of the four Simpson’s papers would be incomplete without mentioning another paper, which represents the thinking within the potential outcome camp. The paper in question is “A Fruitful Resolution to Simpson’s Paradox via Multiresolution Inference,” by Keli Liu and Xiao-Li Meng (2014), http://www.stat.columbia.edu/~gelman/stuff_for_blog/LiuMengTASv2.pdf which appeared in the same issue of Statistical Science as my “Understanding Simpson’s Paradox” http://ftp.cs.ucla.edu/pub/stat_ser/r414-reprint.pdf.

The intriguing feature of Liu and Meng’s paper is that they, too, do not see any connection to causality. In their words: “Peeling away the [Simpson’s] paradox is as easy (or hard) as avoiding a comparison of apples and oranges, a concept requiring no mention of causality” p.17, and again: ” The central issues of Simpson’s paradox can be addressed adequately without necessarily invoking causality.” (p. 18). Two comments:

  1. Liu and Meng fail to see that the distinction between apples and oranges must be made with causal considerations in mind — statistical criteria alone cannot help us avoid a comparison of apples and oranges. This has been shown again and again, even by Simpson himself.
  2. Liu and Meng do not endorse the resolution offered by causal modeling and, as a result, they end up with the wrong conclusion. Quoting: “Simpson’s Warning: less conditioning is most likely to lead to serious bias when Simpson’s Paradox appears.” (p. 17). Again, Simpson himself brings an example where conditioning leads to more bias, not less.

Thus, in contrast to the data-only economists (Spanos), the potential-outcome camp does not object to causal reasoning per-se, this is their specialty. What they object to are attempts to resolve Simpson’s paradox formally and completely, namely, explicate formally what the differences are between “apples and oranges” and deal squarely with the decision problem: “What to do in case of reversal.”

Why are they resisting the complete solution? Because (and this is a speculation) the complete solution requires graphical tools and we all know the attitude of potential-outcome enthusiasts towards graphs. We dealt with this cultural peculiarity before so, at this point, we should just add Simpson’s paradox to their list of challenges, and resign humbly to the slow pace with which Kuhn’s paradigms are shifting.

Judea

Comments (8)

July 14, 2014

On Simpson’s Paradox. Again?

Filed under: Discussion,General,Simpson's Paradox — eb @ 9:10 pm

Simpson’s paradox must have an unbounded longevity, partly because traditional statisticians, so it seems, are still refusing to accept the fact that the paradox is causal, not statistical (link to R-414).

This was demonstrated recently in an April discussion on Gelman’s blog where the paradox was portrayed again as one of those typical cases where conditional associations are different from marginal associations. Strangely, only one or two discussants dared call: “Wait a minute! This is not what the paradox is about!” — to little avail.

To watch the discussion more closely, click http://andrewgelman.com/2014/04/08/understanding-simpsons-paradox-using-graph/ .

Comments (4)

April 24, 2000

Simpson’s paradox and decision trees

Filed under: Decision Trees,Simpson's Paradox — moderator @ 12:14 am

From Nimrod Megiddo (IBM Almaden)

I do not agree that "causality" is the key to resolving the paradox (but this is also a matter of definition) and that tools for looking at it did not exist twenty years ago. Coming from game theory, I think the issue is not difficult for people who like to draw decision trees with "decision" nodes distinguished from "chance" nodes.

I drew two such trees on the attached Word document which I think clarify the correct decision in different circumstances.
Click here for viewing the trees.

Comments (1)
  • Pages
    • About
  • Categories:
    • Announcement
    • Back-door criterion
    • Bad Control
    • Bayesian network
    • Book (J Pearl)
    • Book of Why
    • Bounds
    • Causal Effect
    • Causal models
    • Conferences
    • Counterfactual
    • Counterfactuals
    • covariate selection
    • d-separation
    • DAGs
    • Data Fusion
    • Decision Trees
    • Deep Learning
    • Deep Understanding
    • Definition
    • Discussion
    • do-calculus
    • Econometrics
    • Economics
    • Epidemiology
    • G-estimation
    • Gelman's blog
    • General
    • Generalizability
    • Identification
    • Imbens
    • Indirect effects
    • Intuition
    • Journal of Causal Inference
    • JSM
    • Knowledge representation
    • Ladder of Causation
    • Linear Systems
    • Machine learning
    • Marginal structural models
    • Matching
    • measurement cost
    • Mediated Effects
    • Missing Data
    • Nancy Cartwright
    • Noncompliance
    • Opinion
    • Path Coefficient
    • Plans
    • Presentation
    • Probability
    • Propensity Score
    • RCTs
    • Selection Bias
    • Simpson's Paradox
    • Statistical causality
    • Statistical Time
    • structural equations
    • Uncategorized

  • Archives:
    • March 2023
    • January 2023
    • May 2022
    • April 2021
    • December 2020
    • October 2020
    • July 2020
    • May 2020
    • April 2020
    • January 2020
    • December 2019
    • November 2019
    • September 2019
    • August 2019
    • June 2019
    • March 2019
    • February 2019
    • January 2019
    • December 2018
    • June 2018
    • April 2018
    • March 2018
    • January 2018
    • December 2017
    • August 2017
    • May 2017
    • April 2017
    • February 2017
    • September 2016
    • August 2016
    • July 2016
    • June 2016
    • February 2016
    • November 2015
    • August 2015
    • July 2015
    • May 2015
    • April 2015
    • January 2015
    • December 2014
    • November 2014
    • October 2014
    • September 2014
    • August 2014
    • July 2014
    • April 2014
    • December 2013
    • November 2013
    • October 2013
    • September 2013
    • August 2013
    • July 2013
    • April 2013
    • December 2012
    • November 2012
    • October 2012
    • September 2012
    • August 2012
    • July 2012
    • June 2012
    • February 2012
    • January 2012
    • September 2011
    • August 2011
    • March 2011
    • October 2010
    • June 2010
    • May 2010
    • April 2010
    • February 2010
    • December 2009
    • November 2009
    • September 2009
    • August 2009
    • July 2009
    • June 2009
    • March 2009
    • December 2008
    • October 2008
    • May 2008
    • February 2008
    • December 2007
    • October 2007
    • August 2007
    • June 2007
    • May 2007
    • April 2007
    • March 2007
    • February 2007
    • October 2006
    • September 2006
    • May 2006
    • February 2006
    • February 2004
    • October 2001
    • September 2001
    • April 2001
    • January 2001
    • December 2000
    • November 2000
    • September 2000
    • July 2000
    • June 2000
    • May 2000
    • April 2000
    • March 2000
    • January 2000
    • July 1
  • Meta:
    • Log in
    • RSS
    • Comments RSS
    • Valid XHTML
    • XFN
    • WP

Powered by WordPress