Causal Analysis in Theory and Practice

May 31, 2020

What Statisticians Want to Know about Causal Inference and The Book of Why

Filed under: Causal Effect,DAGs,Discussion,Economics,Epidemiology,Opinion — Judea Pearl @ 4:09 pm

I was privileged to be interviewed recently by David Hand, Professor of Statistics at Imperial College, London, and a former President of the Royal Statistical Society. I would like to share this interview with readers of this blog since many of the questions raised by David keep coming up in my conversations with statisticians and machine learning researchers, both privately and on Twitter.

For me, David represents mainstream statistics and, the reason I find his perspective so valuable is that he does not have a stake in causality and its various formulations. Like most mainstream statisticians, he is simply curious to understand what the big fuss is all about and how to communicate differences among various approaches without taking sides.

So, I’ll let David start, and I hope you find it useful.

Judea Pearl Interview by David Hand

There are some areas of statistics which seem to attract controversy and disagreement, and causal modelling is certainly one of them. In an attempt to understand what all the fuss is about, I asked Judea Pearl about these differences in perspective. Pearl is a world leader in the scientific understanding of causality. He is a recipient of the AMC Turing Award (computing’s “Nobel Prize”), for “fundamental contributions to artificial intelligence through the development of a calculus for probabilistic and causal reasoning”, the David E. Rumelhart Prize for Contributions to the Theoretical Foundations of Human Cognition, and is a Fellow of the American Statistical Association.

QUESTION 1:

I am aware that causal modelling is a hotly contested topic, and that there are alternatives to your perspective – the work of statisticians Don Rubin and Phil Dawid spring to mind, for example. Words like counterfactual, Popperian falsifiability, potential outcomes, appear. I’d like to understand the key differences between the various perspectives, so can you tell me what are the main grounds on which they disagree?

ANSWER 1:

You might be surprised to hear that, despite what seems to be hotly contested debates, there are very few philosophical differences among the various “approaches.” And I put “approaches” in quotes because the differences are more among historical traditions, or “frameworks” than among scientific principles. If we compare, for example, Rubin’s potential outcome with my framework, named “Structural Causal Models” (SCM), we find that the two are logically equivalent; a theorem in one is a theorem in the other and an assumption in one can be written as an assumption in the other. This means that, starting with the same set of assumptions, every solution obtained in one can also be obtained in the other.

But logical equivalence does not means “modeling equivalence” when we consider issues such as transparency, credibility or tractability. The equations for straight lines in polar coordinates are equivalent to those in Cartesian coordinates yet are hardly manageable when it comes to calculating areas of squares or triangles.

In SCM, assumptions are articulated in the form of equations among measured variables, each asserting how one variable responds to changes in another. Graphical models are simple abstractions of those equations and, remarkably, are sufficient for answering many causal questions when applied to non-experimental data. An arrow X—>Y in a graphical model represents the capacity to respond to such changes. All causal relationships are derived mechanically from those qualitative primitives, demanding no further judgment of the modeller.

In Rubin’s framework, assumptions are expressed as conditional independencies among counterfactual variables, also known as “ignorability conditions.” The mental task of ascertaining the plausibility of such assumptions is beyond anyone’s capacity, which makes it extremely hard for researchers to articulate or to verify. For example, the task of deciding which measurements to include in the analysis (or in the propensity score) is intractable in the language of conditional ignorability. Judging whether the assumptions are compatible with the available data, is another task that is trivial in graphical models and insurmountable in the potential outcome framework.

Conceptually, the differences can be summarized thus: The graphical approach goes where scientific knowledge resides, while Rubin’s approach goes where statistical routines need to be justified. The difference shines through when simple problems are solved side by side in both approaches, as in my book Causality (2009). The main reason differences between approaches are still debated in the literature is that most statisticians are watching these debates as outsiders, instead of trying out simple examples from beginning to end. Take for example Simpson’s paradox, a puzzle that has intrigued a century of statisticians and philosophers. It is still as vexing to most statisticians today as it was to Pearson in 1889, and the task of deciding which data to consult, the aggregated or the disaggregated is still avoided by all statistics textbooks.

To summarize, causal modeling, a topic that should be of prime interest to all statisticians, is still perceived to be a “hotly contested topic”, rather than the main frontier of statistical research. The emphasis on “differences between the various perspectives” prevents statisticians from seeing the exciting new capabilities that now avail themselves, and which “enable us to answer questions that we have always wanted but were afraid to ask.” It is hard to tell whether fears of those “differences” prevent statisticians from seeing the excitement, or the other way around, and cultural inhibitions prevent statisticians from appreciating the excitement, and drive them to discuss “differences” instead.

QUESTION 2:

There are different schools of statistics, but I think that most modern pragmatic applied statisticians are rather eclectic, and will choose a method which has the best capability to answer their particular questions. Does the same apply to approaches to causal modelling? That is, do the different perspectives have strengths and weaknesses, and should we be flexible in our choice of approach?

ANSWER 2:

These strengths and weaknesses are seen clearly in the SCM framework, which unifies several approaches and provides a flexible way of leveraging the merits of each. In particular, SCM combines graphical models and potential outcome logic. The graphs are used to encode what we know (i.e., the assumptions we are willing to defend) and the logic is used to encode what we wish to know, that is, the research question of interest. Simple mathematical tools can then combine these two with data and produce consistent estimates.

The availability of these unifying tools now calls on statisticians to become actively involved in causal analysis, rather than attempting to judge approaches from a distance. The choice of approach will become obvious once research questions are asked and the stage is set to articulate subject matter information that is necessary in answering those questions.

QUESTION 3:

To a very great extent the modern big data revolution has been driven by so-called “databased” models and algorithms, where understanding is not necessarily relevant or even helpful, and where there is often no underlying theory about how the variables are related. Rather, the aim is simply to use data to construct a model or algorithm which will predict an outcome from input variables (deep learning neural networks being an illustration). But this approach is intrinsically fragile, relying on an assumption that the data properly represent the population of interest. Causal modelling seems to me to be at the opposite end of the spectrum: it is intrinsically “theory-based”, because it has to begin with a causal model. In your approach, described in an accessible way in your recent book The Book of Why, such models are nicely summarised by your arrow charts. But don’t theory-based models have the complementary risk that they rely heavily on the accuracy of the model? As you say on page 160 of The Book of Why, “provided the model is correct”.

ANSWER 3:

When the tasks are purely predictive, model-based methods are indeed not immediately necessary and deep neural networks perform surprisingly well. This is level-1 (associational) in the Ladder of Causation described in The Book of Why. In tasks involving interventions, however (level-2 of the Ladder), model-based methods become a necessity. There is no way to predict the effect of policy interventions (or treatments) unless we are in possession of either causal assumptions or controlled randomized experiments employing identical interventions. In such tasks, and absent controlled experiments, reliance on the accuracy of the model is inevitable, and the best we can do is to make the model transparent, so that its accuracy can be (1) tested for compatibility with data and/or (2) judged by experts as well as policy makers and/or (3) subjected to sensitivity analysis.

A major reason why statisticians are reluctant to state and rely on untestable modeling assumptions stems from lack of training in managing such assumptions, however plausible. Even stating such unassailable assumptions as “symptoms do not cause diseases” or “drugs do not change patient’s sex” require a vocabulary that is not familiar to the great majority of living statisticians. Things become worse in the potential outcome framework where such assumptions resist intuitive interpretation, let alone judgment of plausibility. It is important at this point to go back and qualify my assertion that causal models are not necessary for purely predictive tasks. Many tasks that, at first glance appear to be predictive, turn out to require causal analysis. A simple example is the problem of external validity or inference across populations. Differences among populations are very similar to differences induced by interventions, hence methods of transporting information from one population to another can leverage all the tools developed for predicting effects of interventions. A similar transfer applies to missing data analysis, traditionally considered a statistical problem. Not so. It is inherently a causal problem since modeling the reason for missingness is crucial for deciding how we can recover from missing data. Indeed modern methods of missing data analysis, employing causal diagrams are able to recover statistical and causal relationships that purely statistical methods have failed to recover.

QUESTION 4:

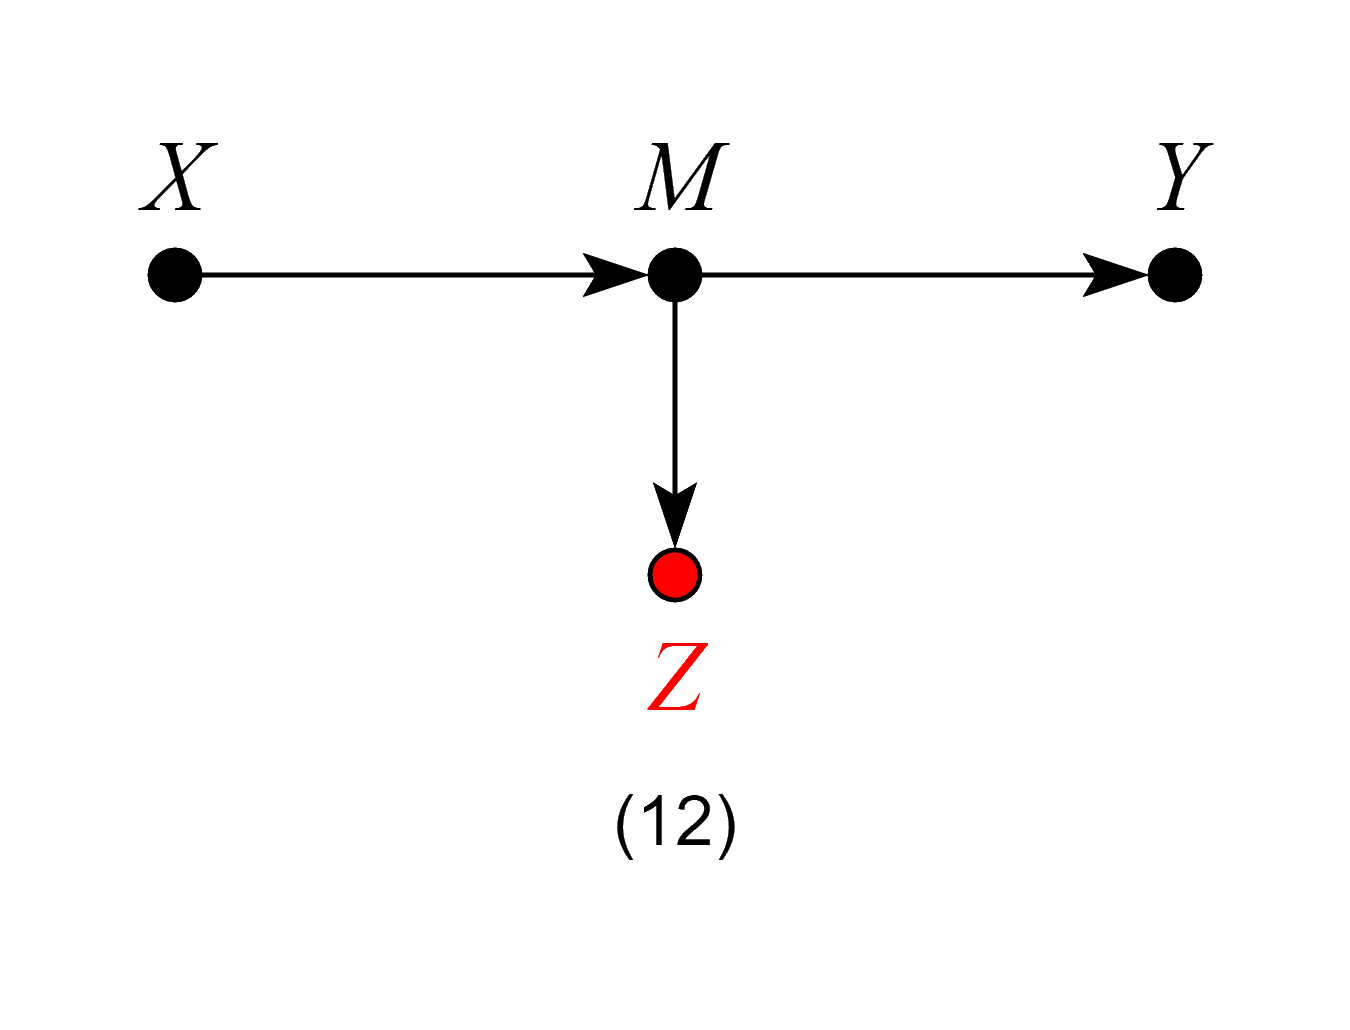
In a related vein, the “backdoor” and “frontdoor” adjustments and criteria described in the book are very elegant ways of extracting causal information from arrow diagrams. They permit causal information to be obtained from observational data. Provided that is, the arrow diagram accurately represents the relationships between all the relevant variables. So doesn’t valid application of this elegant calculus depends critically on the accuracy of the base diagram?

ANSWER 4:

Of course. But as we have agreed above, EVERY exercise in causal inference “depends critically on the accuracy” of the theoretical assumptions we make. Our choice is whether to make these assumptions transparent, namely, in a form that allows us to scrutinize their veracity, or bury those assumptions in cryptic notation that prevents scrutiny.

In a similar vein, I must modify your opening statement, which described the “backdoor” and “frontdoor” criteria as “elegant ways of extracting causal information from arrow diagrams.” A more accurate description would be “…extracting causal information from rudimentary scientific knowledge.” The diagrammatic description of these criteria enhances, rather than restricts their range of applicability. What these criteria in fact do is extract quantitative causal information from conceptual understanding of the world; arrow diagrams simply represent the extent to which one has or does not have such understanding. Avoiding graphs conceals what knowledge one has, as well as what doubts one entertains.

QUESTION 5:

You say, in The Book of Why (p5-6) that the development of statistics led it to focus “exclusively on how to summarise data, not on how to interpret it.” It’s certainly true that when the Royal Statistical Society was established it focused on “procuring, arranging, and publishing ‘Facts calculated to illustrate the Condition and Prospects of Society’,” and said that “the first and most essential rule of its conduct [will be] to exclude carefully all Opinions from its transactions and publications.” But that was in the 1830s, and things have moved on since then. Indeed, to take one example, clinical trials were developed in the first half of the Twentieth Century and have a history stretching back even further. The discipline might have been slow to get off the ground in tackling causal matters, but surely things have changed and a very great deal of modern statistics is directly concerned with causal matters – think of risk factors in epidemiology or manipulation in experiments, for example. So aren’t you being a little unfair to the modern discipline?

ANSWER 5:

Ronald Fisher’s manifesto, in which he pronounced that “the object of statistical methods is the reduction of data” was published in 1922, not in the 19th century (Fisher 1922). Data produced in clinical trials have been the only data that statisticians recognize as legitimate carriers of causal information, and our book devotes a whole chapter to this development. With the exception of this singularity, however, the bulk of mainstream statistics has been glaringly disinterested in causal matters. And I base this observation on three faithful indicators: statistics textbooks, curricula at major statistics departments, and published texts of Presidential Addresses in the past two decades. None of these sources can convince us that causality is central to statistics.

Take any book on the history of statistics, and check if it considers causal analysis to be of primary concern to the leading players in 20th century statistics. For example, Stigler’s The Seven Pillars of Statistical Wisdom (2016) barely makes a passing remark to two (hardly known) publications in causal analysis.

I am glad you mentioned epidemiologists’ analysis of risk factors as an example of modern interest in causal questions. Unfortunately, epidemiology is not representative of modern statistics. In fact epidemiology is the one field where causal diagrams have become a second language, contrary to mainstream statistics, where causal diagrams are still a taboo. (e.g., Efron and Hastie 2016; Gelman and Hill, 2007; Imbens and Rubin 2015; Witte and Witte, 2017).

When an academic colleague asks me “Aren’t you being a little unfair to our discipline, considering the work of so and so?”, my answer is “Must we speculate on what ‘so and so’ did? Can we discuss the causal question that YOU have addressed in class in the past year?” The conversation immediately turns realistic.

QUESTION 6:

Isn’t the notion of intervening through randomisation still the gold standard for establishing causality?

ANSWER 6:

It is. Although in practice, the hegemony of randomized trial is being contested by alternatives. Randomized trials suffer from incurable problems such as selection bias (recruited subject are rarely representative of the target population) and lack of transportability (results are not applicable when populations change). The new calculus of causation helps us overcome these problems, thus achieving greater over all credibility; after all, observational studies are conducted at the natural habitat of the target population.

QUESTION 7:

What would you say are the three most important ideas in your approach? And what, in particular, would you like readers of The Book of Why to take away from the book.

ANSWER 7:

The three most important ideas in the book are: (1) Causal analysis is easy, but requires causal assumptions (or experiments) and those assumptions require a new mathematical notation, and a new calculus. (2) The Ladder of Causation, consisting of (i) association (ii) interventions and (iii) counterfactuals, is the Rosetta Stone of causal analysis. To answer a question at layer (x) we must have assumptions at level (x) or higher. (3) Counterfactuals emerge organically from basic scientific knowledge and, when represented in graphs, yield transparency, testability and a powerful calculus of cause and effect. I must add a fourth take away: (4) To appreciate what modern causal analysis can do for you, solve one toy problem from beginning to end; it would tell you more about statistics and causality than dozens of scholarly articles laboring to overview statistics and causality.

REFERENCES

Efron, B. and Hastie, T., Computer Age Statistical Inference: Algorithms, Evidence, and Data Science, New York, NY: Cambridge University Press, 2016.

Fisher, R., “On the mathematical foundations of theoretical statistics,” Philosophical Transactions of the Royal Society of London, Series A 222, 311, 1922.

Gelman, A. and Hill, J., Data Analysis Using Regression and Multilevel/Hierarchical Models, New York: Cambridge University Press, 2007.

Imbens, G.W. and Rubin, D.B., Causal Inference for Statistics, Social, and Biomedical Sciences: An Introduction, Cambridge, MA: Cambridge University Press, 2015.

Witte, R.S. and Witte, J.S., Statistics, 11th edition, Hoboken, NJ: John Wiley & Sons, Inc. 2017.

August 14, 2019

A Crash Course in Good and Bad Control

Filed under: Back-door criterion,Bad Control,Econometrics,Economics,Identification — Judea Pearl @ 11:26 pm

Carlos Cinelli, Andrew Forney and Judea Pearl

Update: check the updated and extended version of the crash course here.

Introduction

If you were trained in traditional regression pedagogy, chances are that you have heard about the problem of “bad controls”. The problem arises when we need to decide whether the addition of a variable to a regression equation helps getting estimates closer to the parameter of interest. Analysts have long known that some variables, when added to the regression equation, can produce unintended discrepancies between the regression coefficient and the effect that the coefficient is expected to represent. Such variables have become known as “bad controls”, to be distinguished from “good controls” (also known as “confounders” or “deconfounders”) which are variables that must be added to the regression equation to eliminate what came to be known as “omitted variable bias” (OVB).

Recent advances in graphical models have produced a simple criterion to distinguish good from bad controls, and the purpose of this note is to provide practicing analysts a concise and visible summary of this criterion through illustrative examples. We will assume that readers are familiar with the notions of “path-blocking” (or d-separation) and back-door paths. For a gentle introduction, see d-Separation without Tears

In the following set of models,  the target of the analysis is the average causal effect (ACE) of a treatment X on an outcome Y, which stands for the expected increase of Y per unit of a controlled increase in X. Observed variables will be designated by black dots and unobserved variables by white empty circles. Variable Z (highlighted in red) will represent the variable whose inclusion in the regression is to be decided, with “good control” standing for bias reduction, “bad control” standing for bias increase and “netral control” when the addition of Z does not increase nor reduce bias. For this last case, we will also make a brief remark about how Z could affect the precision of the ACE estimate.

Models

Models 1, 2 and 3 – Good Controls 

In model 1,  Z stands for a common cause of both X and Y. Once we control for Z, we block the back-door path from X to Y, producing an unbiased estimate of the ACE. 

In models 2 and 3, Z is not a common cause of both X and Y, and therefore, not a traditional “confounder” as in model 1. Nevertheless, controlling for Z blocks the back-door path from X to Y due to the unobserved confounder U, and again, produces an unbiased estimate of the ACE.

Models 4, 5 and 6 – Good Controls

When thinking about possible threats of confounding, one needs to keep in mind that common causes of X and any mediator (between X and Y) also confound the effect of X on Y. Therefore, models 4, 5 and 6 are analogous to models 1, 2 and 3 — controlling for Z blocks the backdoor path from X to Y and produces an unbiased estimate of the ACE.

Model 7 – Bad Control

We now encounter our first “bad control”. Here Z is correlated with the treatment and the outcome and it is also a “pre-treatment” variable. Traditional econometrics textbooks would deem Z a “good control”. The backdoor criterion, however, reveals that Z is a “bad control”. Controlling for Z will induce bias by opening the backdoor path X ← U1→ Z← U2→Y, thus spoiling a previously unbiased estimate of the ACE.

Model 8 – Neutral Control (possibly good for precision)

Here Z is not a confounder nor does it block any backdoor paths. Likewise, controlling for Z does not open any backdoor paths from X to Y. Thus, in terms of bias, Z is a “neutral control”. Analysis shows, however, that controlling for Z reduces the variation of the outcome variable Y, and helps improve the precision of the ACE estimate in finite samples.

Model 9 – Neutral control (possibly bad for precision)

Similar to the previous case, here Z is “neutral” in terms of bias reduction. However, controlling for Z will reduce the variation of treatment variable X and so may hurt the precision of the estimate of the ACE in finite samples.  

Model 10 – Bad control

We now encounter our second “pre-treatment” “bad control”, due to a phenomenon called “bias amplification” (read more here). Naive control for Z in this model will not only fail to deconfound the effect of X on Y, but, in linear models, will amplify any existing bias.

Models 11 and 12 – Bad Controls

If our target quantity is the ACE, we want to leave all channels through which the causal effect flows “untouched”.

In Model 11, Z is a mediator of the causal effect of X on Y. Controlling for Z will block the very effect we want to estimate, thus biasing our estimates. 

In Model 12, although Z is not itself a mediator of the causal effect of X on Y, controlling for Z is equivalent to partially controlling for the mediator M, and will thus bias our estimates.

Models 11 and 12 violate the backdoor criterion, which excludes controls that are descendants of the treatment along paths to the outcome.

Model 13 – Neutral control (possibly good for precision)

At first look, model 13 might seem similar to model 12, and one may think that adjusting for Z would bias the effect estimate, by restricting variations of the mediator M. However, the key difference here is that Z is a cause, not an effect, of the mediator (and, consequently, also a cause of Y). Thus, model 13 is analogous to model 8, and so controlling for Z will be neutral in terms of bias and may increase precision of the ACE estimate in finite samples.

Model 14 – Neutral controls (possibly helpful in the case of selection bias)

Contrary to econometrics folklore, not all “post-treatment” variables are inherently bad controls. In models 14 and 15 controlling for Z does not open any confounding paths between X and Y. Thus, Z is neutral in terms of bias. However, controlling for Z does reduce the variation of the treatment variable X and so may hurt the precision of the ACE estimate in finite samples. Additionally, in model 15, suppose one has only samples with W = 1 recorded (a case of selection bias). In this case, controlling for Z can help obtaining the W-specific effect of X on Y, by blocking the colliding path due to W.

Model 16 – Bad control

Contrary to Models 14 and 15, here controlling for Z is no longer harmless, since it opens the backdoor path X → Z ← U → Y and so biases the ACE.

Model 17 – Bad Control

Here, Z is not a mediator, and one might surmise that, as in Model 14, controlling for Z is harmless. However, controlling for the effects of the outcome Y will induce bias in the estimate of the ACE, making Z a “bad control”. A visual explanation of this phenomenon using “virtual colliders” can be found here.

Model 17 is usually known as a “case-control bias” or “selection bias”. Finally, although controlling for Z will generally bias numerical estimates of the ACE, it does have an exception when X has no causal effect on Y. In this scenario, X is still d-separated from Y even after conditioning on Z. Thus, adjusting for Z is valid for testing whether the effect of X on Y is zero.

February 22, 2017

Winter-2017 Greeting from UCLA Causality Blog

Filed under: Announcement,Causal Effect,Economics,Linear Systems — bryantc @ 6:03 pm

Dear friends in causality research,

In this brief greeting I would like to first call attention to an approaching deadline and then discuss a couple of recent articles.

1.
Causality in Education Award – March 1, 2017

We are informed that the deadline for submitting a nomination for the ASA Causality in Statistics Education Award is March 1, 2017. For purpose, criteria and other information please see http://www.amstat.org/education/causalityprize/ .

2.
The next issue of the Journal of Causal Inference (JCI) is schedule to appear March, 2017. See https://www.degruyter.com/view/j/jci

MY contribution to this issue includes a tutorial paper entitled: “A Linear ‘Microscope’ for Interventions and Counterfactuals”. An advance copy can be viewed here: http://ftp.cs.ucla.edu/pub/stat_ser/r459.pdf
Enjoy!

3.
Overturning Econometrics Education (or, do we need a “causal interpretation”?)

My attention was called to a recent paper by Josh Angrist and Jorn-Steffen Pischke titled: “Undergraduate econometrics instruction” (A NBER working paper) http://www.nber.org/papers/w23144?utm_campaign=ntw&utm_medium=email&utm_source=ntw

This paper advocates a pedagogical paradigm shift that has methodological ramifications beyond econometrics instruction; As I understand it, the shift stands contrary to the traditional teachings of causal inference, as defined by Sewall Wright (1920), Haavelmo (1943), Marschak (1950), Wold (1960), and other founding fathers of econometrics methodology.

In a nut shell, Angrist and Pischke  start with a set of favorite statistical routines such as IV, regression, differences-in-differences among others, and then search for “a set of control variables needed to insure that the regression-estimated effect of the variable of interest has a causal interpretation”. Traditional causal inference (including economics) teaches us that asking whether the output of a statistical routine “has a causal interpretation” is the wrong question to ask, for it misses the direction of the analysis. Instead, one should start with the target causal parameter itself, and asks whether it is ESTIMABLE (and if so how), be it by IV, regression, differences-in-differences, or perhaps by some new routine that is yet to be discovered and ordained by name. Clearly, no “causal interpretation” is needed for parameters that are intrinsically causal; for example, “causal effect”, “path coefficient”, “direct effect”, “effect of treatment on the treated”, or “probability of causation”.

In practical terms, the difference between the two paradigms is that estimability requires a substantive model while interpretability appears to be model-free. A model exposes its assumptions explicitly, while statistical routines give the deceptive impression that they run assumptions-free (hence their popular appeal). The former lends itself to judgmental and statistical tests, the latter escapes such scrutiny.

In conclusion, if an educator needs to choose between the “interpretability” and “estimability” paradigms, I would go for the latter. If traditional econometrics education
is tailored to support the estimability track, I do not believe a paradigm shift is warranted towards an “interpretation seeking” paradigm as the one proposed by Angrist and Pischke,

I would gladly open this blog for additional discussion on this topic.

I tried to post a comment on NBER (National Bureau of Economic Research), but was rejected for not being an approved “NBER family member”. If any of our readers is a “”NBER family member” feel free to post the above. Note: “NBER working papers are circulated for discussion and comment purposes.” (page 1).

November 9, 2014

Causal inference without graphs

Filed under: Counterfactual,Discussion,Economics,General — moderator @ 3:45 am

In a recent posting on this blog, Elias and Bryant described how graphical methods can help decide if a pseudo-randomized variable, Z, qualifies as an instrumental variable, namely, if it satisfies the exogeneity and exclusion requirements associated with the definition of an instrument. In this note, I aim to describe how inferences of this type can be performed without graphs, using the language of potential outcome. This description should give students of causality an objective comparison of graph-less vs. graph-based inferences. See my exchange with Guido Imbens [here].

Every problem of causal inference must commence with a set of untestable, theoretical assumptions that the modeler is prepared to defend on scientific grounds. In structural modeling, these assumptions are encoded in a causal graph through missing arrows and missing latent variables. Graphless methods encode these same assumptions symbolically, using two types of statements:

1. Exclusion restrictions, and
2. Conditional independencies among observable and potential outcomes.

For example, consider the causal Markov chain 
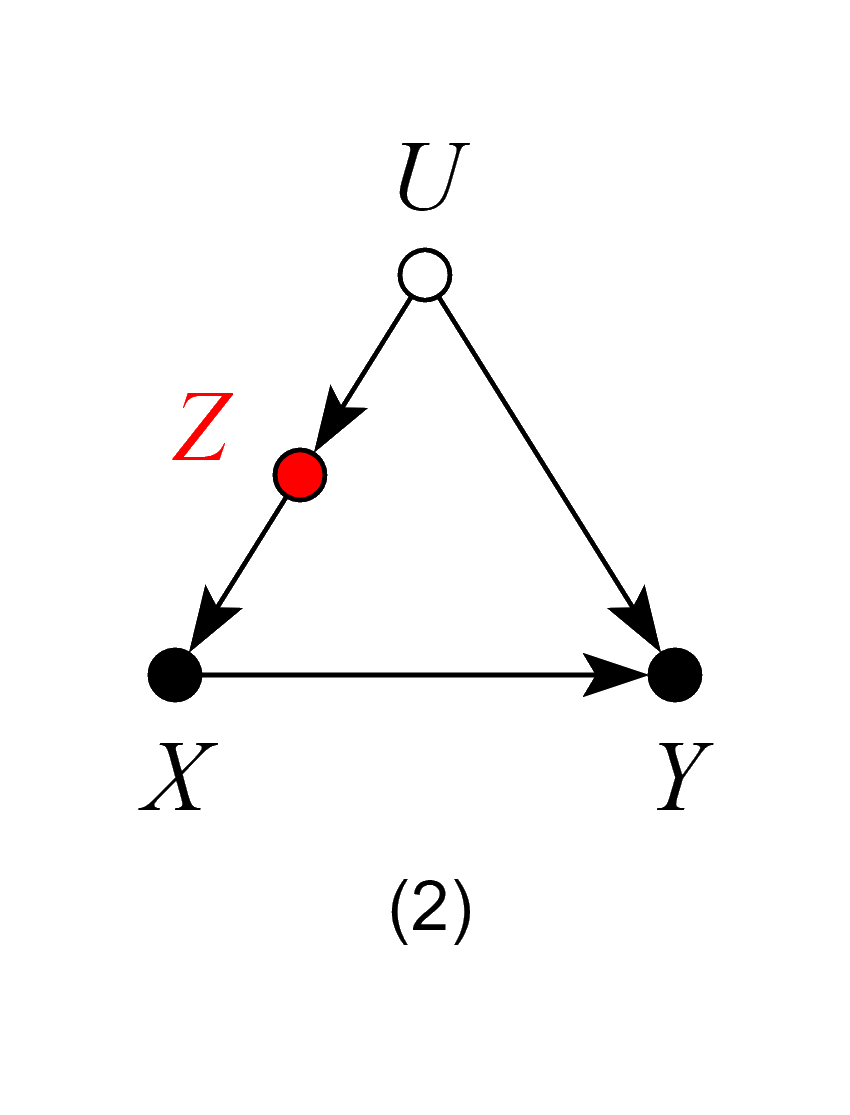
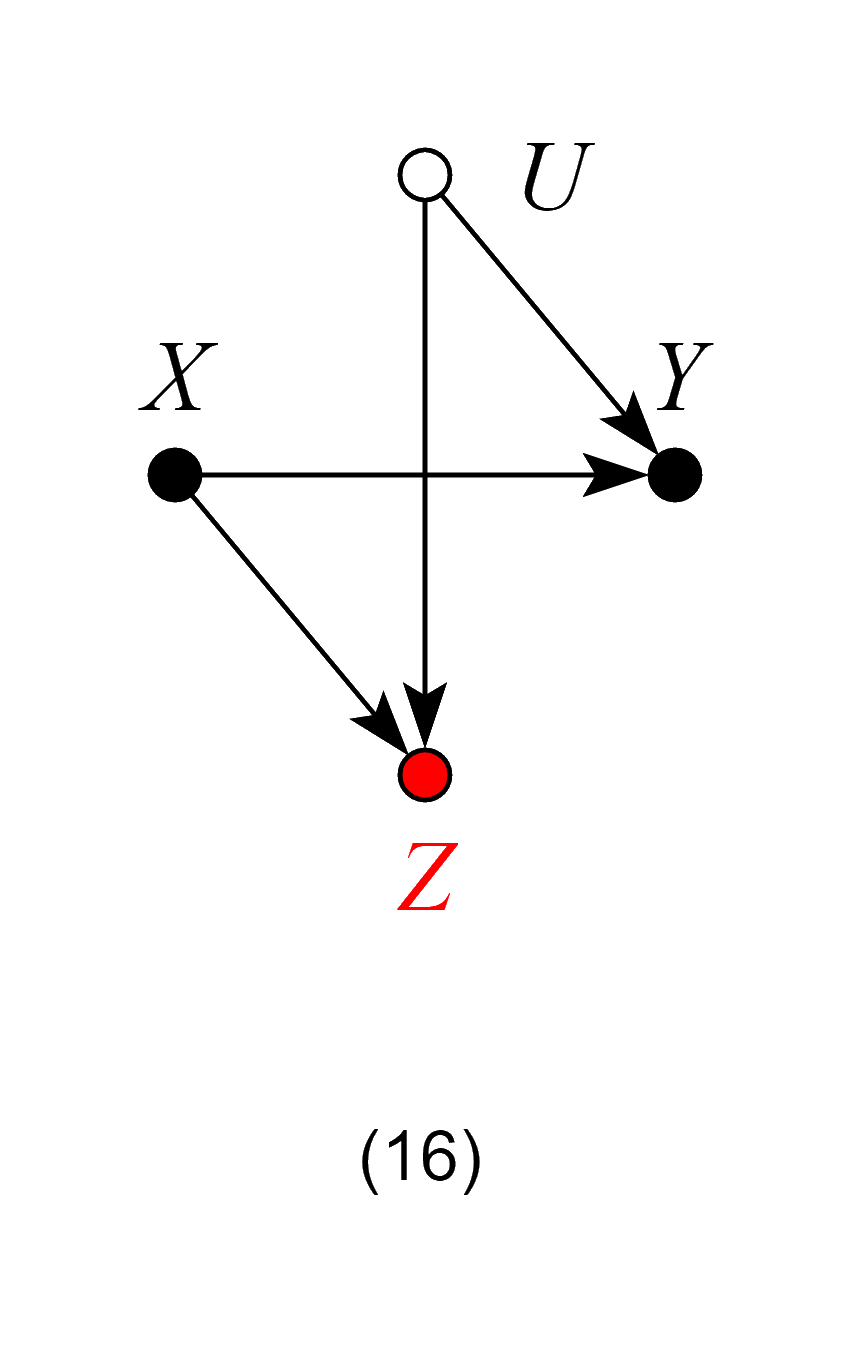
which represents the structural equations:
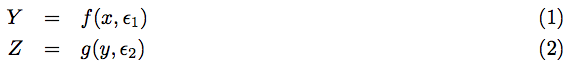
with and being omitted factors such that X, , are mutually independent.

These same assumptions can also be encoded in the language of counterfactuals, as follows:

(3) represents the missing arrow from X to Z, and (4)-(6) convey the mutual independence of X, , and .
[Remark: General rules for translating graphical models to counterfactual notation are given in Pearl (2009, pp. 232-234).]

Assume now that we are given the four counterfactual statements (3)-(6) as a specification of a model; What machinery can we use to answer questions that typically come up in causal inference tasks? One such question is, for example, is the model testable? In other words, is there an empirical test conducted on the observed variables X, Y, and Z that could prove (3)-(6) wrong? We note that none of the four defining conditions (3)-(6) is testable in isolation, because each invokes an unmeasured counterfactual entity. On the other hand, the fact the equivalent graphical model advertises the conditional independence of X and Z given Y, X _||_ Z | Y, implies that the combination of all four counterfactual statements should yield this testable implication.

Another question often posed to causal inference is that of identifiability, for example, whether the
causal effect of X on Z is estimable from observational studies.

Whereas graphical models enjoy inferential tools such as d-separation and do-calculus, potential-outcome specifications can use the axioms of counterfactual logic (Galles and Pearl 1998, Halpern, 1998) to determine identification and testable implication. In a recent paper, I have combined the graphoid and counterfactual axioms to provide such symbolic machinery (link).

However, the aim of this note is not to teach potential outcome researchers how to derive the logical consequences of their assumptions but, rather, to give researchers the flavor of what these derivation entail, and the kind of problems the potential outcome specification presents vis a vis the graphical representation.

As most of us would agree, the chain appears more friendly than the 4 equations in (3)-(6), and the reasons are both representational and inferential. On the representational side we note that it would take a person (even an expert in potential outcome) a pause or two to affirm that (3)-(6) indeed represent the chain process he/she has in mind. More specifically, it would take a pause or two to check if some condition is missing from the list, or whether one of the conditions listed is redundant (i.e., follows logically from the other three) or whether the set is consistent (i.e., no statement has its negation follows from the other three). These mental checks are immediate in the graphical representation; the first, because each link in the graph corresponds to a physical process in nature, and the last two because the graph is inherently consistent and non-redundant. As to the inferential part, using the graphoid+counterfactual axioms as inference rule is computationally intractable. These axioms are good for confirming a derivation if one is proposed, but not for finding a derivation when one is needed.

I believe that even a cursory attempt to answer research questions using (3)-(5) would convince the reader of the merits of the graphical representation. However, the reader of this blog is already biased, having been told that (3)-(5) is the potential-outcome equivalent of the chain X—>Y—>Z. A deeper appreciation can be reached by examining a new problem, specified in potential- outcome vocabulary, but without its graphical mirror.

Assume you are given the following statements as a specification.

It represents a familiar model in causal analysis that has been throughly analyzed. To appreciate the power of graphs, the reader is invited to examine this representation above and to answer a few questions:

a) Is the process described familiar to you?
b) Which assumption are you willing to defend in your interpretation of the story.
c) Is the causal effect of X on Y identifiable?
d) Is the model testable?

I would be eager to hear from readers
1. if my comparison is fair.
2. which argument they find most convincing.

October 27, 2014

Are economists smarter than epidemiologists? (Comments on Imbens’s recent paper)

Filed under: Discussion,Economics,Epidemiology,General — eb @ 4:45 pm

In a recent survey on Instrumental Variables (link), Guido Imbens fleshes out the reasons why some economists “have not felt that graphical models have much to offer them.”

His main point is: “In observational studies in social science, both these assumptions [exogeneity and exclusion] tend to be controversial. In this relatively simple setting [3-variable IV setting] I do not see the causal graphs as adding much to either the understanding of the problem, or to the analyses.” [page 377]

What Imbens leaves unclear is whether graph-avoiding economists limit themselves to “relatively simple settings” because, lacking graphs, they cannot handle more than 3 variables, or do they refrain from using graphs to prevent those “controversial assumptions” from becoming transparent, hence amenable to scientific discussion and resolution.

When students and readers ask me how I respond to people of Imbens’s persuasion who see no use in tools they vow to avoid, I direct them to the post “The deconstruction of paradoxes in epidemiology”, in which Miquel Porta describes the “revolution” that causal graphs have spawned in epidemiology. Porta observes: “I think the “revolution — or should we just call it a renewal”? — is deeply changing how epidemiological and clinical research is conceived, how causal inferences are made, and how we assess the validity and relevance of epidemiological findings.”

So, what is it about epidemiologists that drives them to seek the light of new tools, while economists (at least those in Imbens’s camp) seek comfort in partial blindness, while missing out on the causal revolution? Can economists do in their heads what epidemiologists observe in their graphs? Can they, for instance, identify the testable implications of their own assumptions? Can they decide whether the IV assumptions (i.e., exogeneity and exclusion) are satisfied in their own models of reality? Of course the can’t; such decisions are intractable to the graph-less mind. (I have challenged them repeatedly to these tasks, to the sound of a pin-drop silence)

Or, are problems in economics different from those in epidemiology? I have examined the structure of typical problems in the two fields, the number of variables involved, the types of data available, and the nature of the research questions. The problems are strikingly similar.

I have only one explanation for the difference: Culture.

The arrow-phobic culture started twenty years ago, when Imbens and Rubin (1995) decided that graphs “can easily lull the researcher into a false sense of confidence in the resulting causal conclusions,” and Paul Rosenbaum (1995) echoed with “No basis is given for believing” […] “that a certain mathematical operation, namely this wiping out of equations and fixing of variables, predicts a certain physical reality” [ See discussions here. ]

Lingering symptoms of this phobia are still stifling research in the 2nd decade of our century, yet are tolerated as scientific options. As Andrew Gelman put it last month: “I do think it is possible for a forward-looking statistician to do causal inference in the 21st century without understanding graphical models.” (link)

I believe the most insightful diagnosis of the phenomenon is given by Larry Wasserman:
“It is my impression that the “graph people” have studied the Rubin approach carefully while the reverse is not true.” (link)

December 27, 2012

Causal Inference Symposium: Heckman and Pearl

Filed under: Discussion,Economics,General — eb @ 2:30 pm

Judea Pearl Writes:

Last week I attended a causal inference symposium at the University of Michigan, and had a very lively discussion with James Heckman (Chicago, economics) on causal reasoning in econometrics, statistics and computer science. Video and slides of the two lectures can be watched here: http://www.psc.isr.umich.edu/pubs/video-tapes.html

In the QA session (not in the video), I described the problems of transportability and external validity, and their solutions according to:
http://ftp.cs.ucla.edu/pub/stat_ser/r372.pdf
http://ftp.cs.ucla.edu/pub/stat_ser/r390.pdf

Heckman asked: What makes this problem different from the one that economists solve routinely — when they find a new distribution that differs from the one they estimated, they simply re-estimate the parameters by which the two differ and keep those on which they agree.

My answer stressed three facts that should be kept in mind when dealing with “transporatability”:
1. We cannot speak here about differing “distributions” because transportability is a causal, not statistical problem. In other words, what needs to be re-estimated depends not on the two “distributions” but on the causal story behind the distributions. (This is shown vividly in Example 2 of R-372).

2. We are now dealing with the task of transporting “experimental findings” (e.g., causal effects), not distributions, from a place where they are available to a place where they are not estimable.

3. We cannot even speak about re-estimating “parameters” because the problem is entirely non-parametric.

More comments on audience questions will follow.

December 17, 2012

Blog discussion on Causality in Econometric and Statistical education

Filed under: Announcement,Discussion,Economics — moderator @ 1:30 am

A recent discussion on Andrew Gelman’s blog has touched on some interesting points concerning the teaching of causality in econometric and statistics classes (link here). I responded to some of the discussants and, below, I share my replies with readers of this blog.

1. Andrew Gelman asked why the review in http://ftp.cs.ucla.edu/pub/stat_ser/r395.pdf is critical of econometrics, “I thought that causality was central to econometrics; see, for example, Angrist and Pischke’s book .”

Judea Pearl replies:
Causality is indeed central to econometrics. Our survey of econometric textbooks http://ftp.cs.ucla.edu/pub/stat_ser/r395.pdf is critical of econometric education today, not of econometric methodology proper. Econometric models, from the time of Haavelmo (1943), have been and remained causal (see http://ftp.cs.ucla.edu/pub/stat_ser/r391.pdf ) despite two attempted hijacking, first by regressionists, and second by “quasi-experimentalists,” like Angrist and Paschke (AP). The six textbooks we reviewed reflect a painful recovery from the regressionist assault which more or less disappeared from serious econometric research, but is still obfuscating authors of econometric textbooks.

As to the debate between the structuralists and experimentalists, I address it in Section 4 of this article: (see http://ftp.cs.ucla.edu/pub/stat_ser/r391.pdf)

Your review of Angrist and Paschke book “Mostly Harmless Econometrics” leaves out what in my opinion is the major drawback of their methodology: sole reliance of instrumental variables and failure to express and justify the assumptions that underlie the choice of instruments. Since the choice of instruments rests on the same type of assumptions (ie.,exclusion and exogeneity) that Angrist and Paschke are determined to avoid (for being “unreliable,) readers are left with no discussion of what assumptions do go into the choice of instruments, how they are encoded in a model, what scientific knowledge can be used to defend them, and whether the assumptions have any testable implications.

In your review, you point out that Angrist and Pischke completely avoid the task of model-building; I agree. And I attribute this avoidance, not to lack of good intentions but to lacking mathematical tools necessary for model-building. Angrist and Pischke have deprived themselves of using such tools by making an exclusive commitment to the potential outcome language, while shunning the language of nonparametric structural models. This is something only he/she can appreciate who attempted to solve a problem, from start to end, in both languages, side by side. No philosophy, ideology, or hours of blog discussion can replace the insight one can gain by such an exercise.

2. A discussant named Jack writes:
An economist (econometrician) friend of mine often corresponds with Prof. Pearl, and what I understand is that Pearl believes the econometrics approach to causality is deeply, fundamentally wrong. (And econometricians tend to think Pearl’s approach is fundamentally wrong.) It sounds to me like Pearl was being purposefully snarky.

Judea Pearl replies:
Jack, I think you misunderstood what your friend told you. If you read my papers and books you will come to realize immediately that I believe the econometrics approach to causality is deeply an fundamentally right (I repeat: RIGHT, not WRONG). Though, admittedly, there have been two attempts to distort this approach by influx of researchers from adjacent fields (see my reply to Andrew on this page, or read http://ftp.cs.ucla.edu/pub/stat_ser/r391.pdf

Next, I think you are wrong in concluding that “econometricians tend to think Pearl’s approach is fundamentally wrong”. First, I do not offer anyone “an approach,” I offer mathematical tools to do what researchers say they wish to do, only with less effort and greater clarity; researchers may choose to use or ignore these tools. By analogy, the invention of the microscope was not “an approach” but a new tool.

Second, I do not know a single econometrician who tried my microscope and thought it is “fundamentally wrong”, the dismissals I often hear come invariably from those who refuse to look at the microscope for religious reasons.

Finally, since you went through the trouble of interpreting hearsay and labeling me “purposefully snarky,” I think you owe readers of this blog ONE concrete example where I criticize an economist for reasons that you judge to be unjustified. You be the judge.

3. An Anonymous discussant writes:
Yes, the problem with the econometrics approach is that it lumps together identification, estimation, and probability, so papers look like a Xmas tree. It all starts with chapter 1 in econometrics textbooks and all those assumptions about the disturbance, linearity, etc. Yet most discussions in causality oriented papers revolve around identification and for that you can mostly leave out functional forms, estimation, and probability.

Why carry around reams of parametric notation when it ain’t needed? One wonders how Galileo, Newton, or Franklin ever discovered anything without X’X^(-1)X’Y?

Judea Pearl replies:
To all discussants:
I hear many voices agreeing that statistics education needs a shot of relevancy, and that causality is one area where statistics education has stifled intuition and creativity. I therefore encourage you to submit nominations for the causality in statistics prize, as described in http://www.amstat.org/education/causalityprize/ and http://magazine.amstat.org/blog/2012/11/01/pearl/

Please note that the criteria for the prize do not require fancy formal methods; they are problem-solving oriented. The aim is to build on the natural intuition that students bring with them, and leverage it with elementary mathematical tools so that they can solve simple problems with comfort and confidence (not like their professors). The only skills they need to acquire are: (1) Articulate the question, (2) Specify the assumptions needed to answer it and (3) Determine if the assumptions have testable implications. The reasons we cannot totally dispose of mathematical tools are: (1) scientists have local intuitions about different parts of a problem and only mathematics can put them all together coherently, (2) eventually, these intuitions will need to be combined with data to come up with assessments of strengths and magnitudes (e.g., of effects). We do not know how to combine data with intuition in any other way, except through mathematics.

Recall, Pythagoras theorem served to amplify, not stifle the intuitions of ancient geometers.

May 17, 2007

More on Where Economic Modeling is Heading

Filed under: Discussion,Economics — judea @ 1:00 am

Judea Pearl writes:

My previous posting in this forum raised questions regarding Jim Heckman's analysis of causal effects, as described in his article, "The Scientific Model of Causality" (Sociological Methodology, Vol. 35 (1) page 40.)

To help answer these questions, Professor Heckman was kind enough to send me a more recent paper entitled: "Econometric Evaluation of Social Programs," by Heckman and Vytlacil (Draft of Dec. 12, 2006. Prepared for The Handbook of Econometrics, Vol. VI, ed by J. Heckman and E. Leamer, North Holland, 2006.)

This paper indeed clarifies some of my questions, yet raises others. I will share with readers my current thoughts on Heckman's approach to causality and on where causality is heading in econometrics.

(Post edited 5/4: revisions in red, thanks to feedback from David Pattison)
(Post edited 5/17: correction and new comments by LeRoy and Pearl)

(more…)

March 21, 2007

Where is economic modelling today?

Filed under: Economics,Opinion — judea @ 8:30 am

In his 2005 article "The Scientific Model of Causality" (Sociological Methodology, vol. 35 (1) page 40,) Jim Heckman reviews the historical development of causal notions in econometrics, and paints an extremely complimentary picture of the current state of this development.

As an illustration of econometric methods and concepts, Heckman discusses the classical problem of estimating the causal effect of Y2 on Y1 in the following systems of equations

Y1 = a1 + c12Y2 + b11X1 + b12 X2 + U1     (16a)
Y2 = a2 + c21Y1 + b21X1 + b22 X2 + U2     (16b)

where Y1 and Y2 represent, respectively, the consumption levels of two interacting agents, and X1, X2, the levels of their income.

Unexpectedly, on page 44, Heckman makes a couple of remarks that almost threw me off my chair; here they are:

"Controlled variation in external (forcing) variables is the key to defining causal effects in nonrecursive models. It is of some interest to readers of Pearl (2000) to compare my use of the standard simultaneous equations model of econometrics in defining causal parameters to his. In the context of equations (16a) and (16b), Pearl defines a causal effect by "shutting one equation down" or performing "surgery" in his colorful language."

"He implicitly assumes that "surgery," or shutting down an equation in a system of simultaneous equations, uniquely fixes one outcome or internal variable (the consumption of the other person in my example). In general, it does not. Putting a constraint on one equation places a restriction on the entire set of internal variables. In general, no single equation in a system of simultaneous equation uniquely determines any single outcome variable. Shutting down one equation might also affect the parameters of the other equations in the system and violate the requirements of parameter stability."

I wish to bring up for blog discussion the following four questions:

  1. Is Heckman right in stating that in nonrecursive systems one should not define causal effect by surgery?
  2. What is the causal effect of Y2 on Y1 in the model of Eqs. (16a -16b) ??
  3. What does Heckman mean when he objects to surgery as the basis for defining causal parameters?
  4. What did he have in mind when he offered "… the standard simultaneous equations model of econometrics" as an alternative to surgery "in defining causal parameters"?

The following are the best answers I could give to these questions, but I would truly welcome insights from other participants, especially economists and social scientists (including Jim Heckman, of course).

(more…)

Powered by WordPress